
Hey everyone,
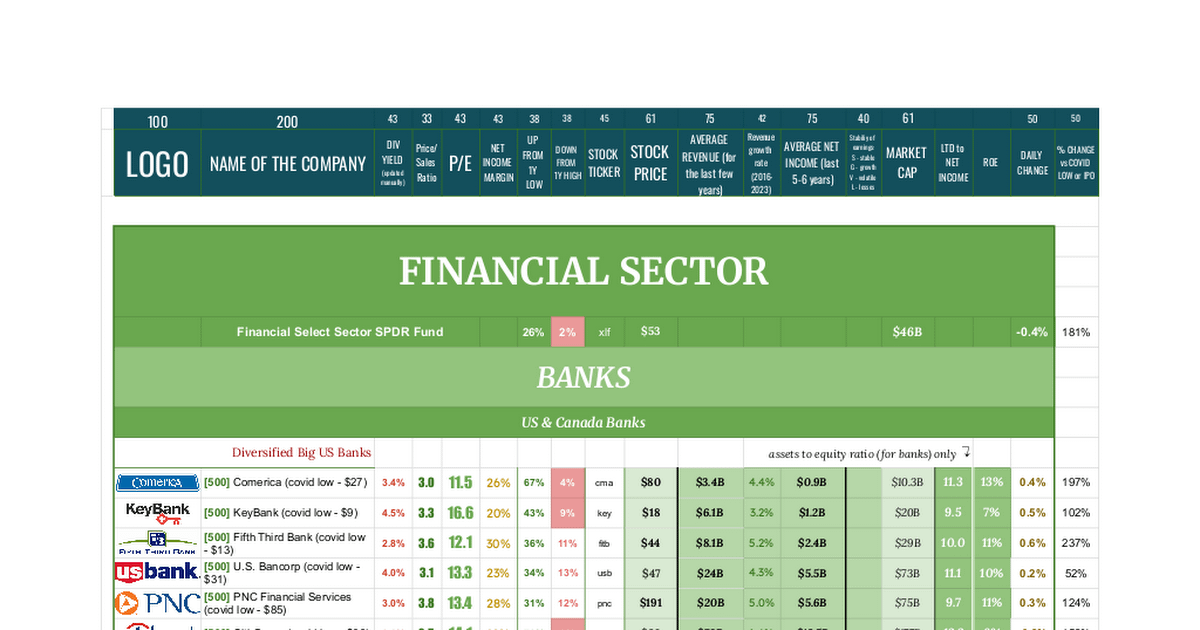
I thought I’d share a Google Sheets watchlist that tracks a large number of companies – it’s been updated recently and now includes 3,000+ companies organized by sector and industry. The sheet shows live stock prices, 52-week highs/lows, market cap, daily changes, dividend info, average revenue and net income estimates, LTD-to-average-earnings ratios, ROE ratios, and more.
A quick note – some of the data points like average revenue, net income, long-term-debt-to-average-earnings ratio, and ROE are subjective estimates I calculated myself. The revenue and net income figures represent what I believe a company might earn in a normal business environment. The LTD to earnings and ROE numbers are based on those averages (and on equity averages from recent years). They’re not exact figures, but they do help paint a more realistic picture of each company’s general performance and current valuation.
It’s view-only (so the data stays clean).
The main reason I find it useful is to spot companies that might be strong long-term businesses – for example, ones with high ROE, low LTD-to-average-earnings, stable earnings, and relatively low price compared to these metrics. Even if you use it just to get a broad overview or compare companies quickly, it can save a lot of time.
https://docs.google.com/spreadsheets/d/1K2Wmqi2evfMWILp3Dxr7j0GH5h-g5WmwYHyAQpndPyw/edit?usp=sharing
📊 Updated Google Sheets stock watchlist (3,000+ companies, live data)
byu/PresentCautious3374 inStockMarket
Posted by PresentCautious3374
1 Comment
😘