
People forget that options strategies ALWAYS have a trade off, but imo, and it should always be the case, that you think the likely outcome, favors your strategy, over purely shares/any other strategy
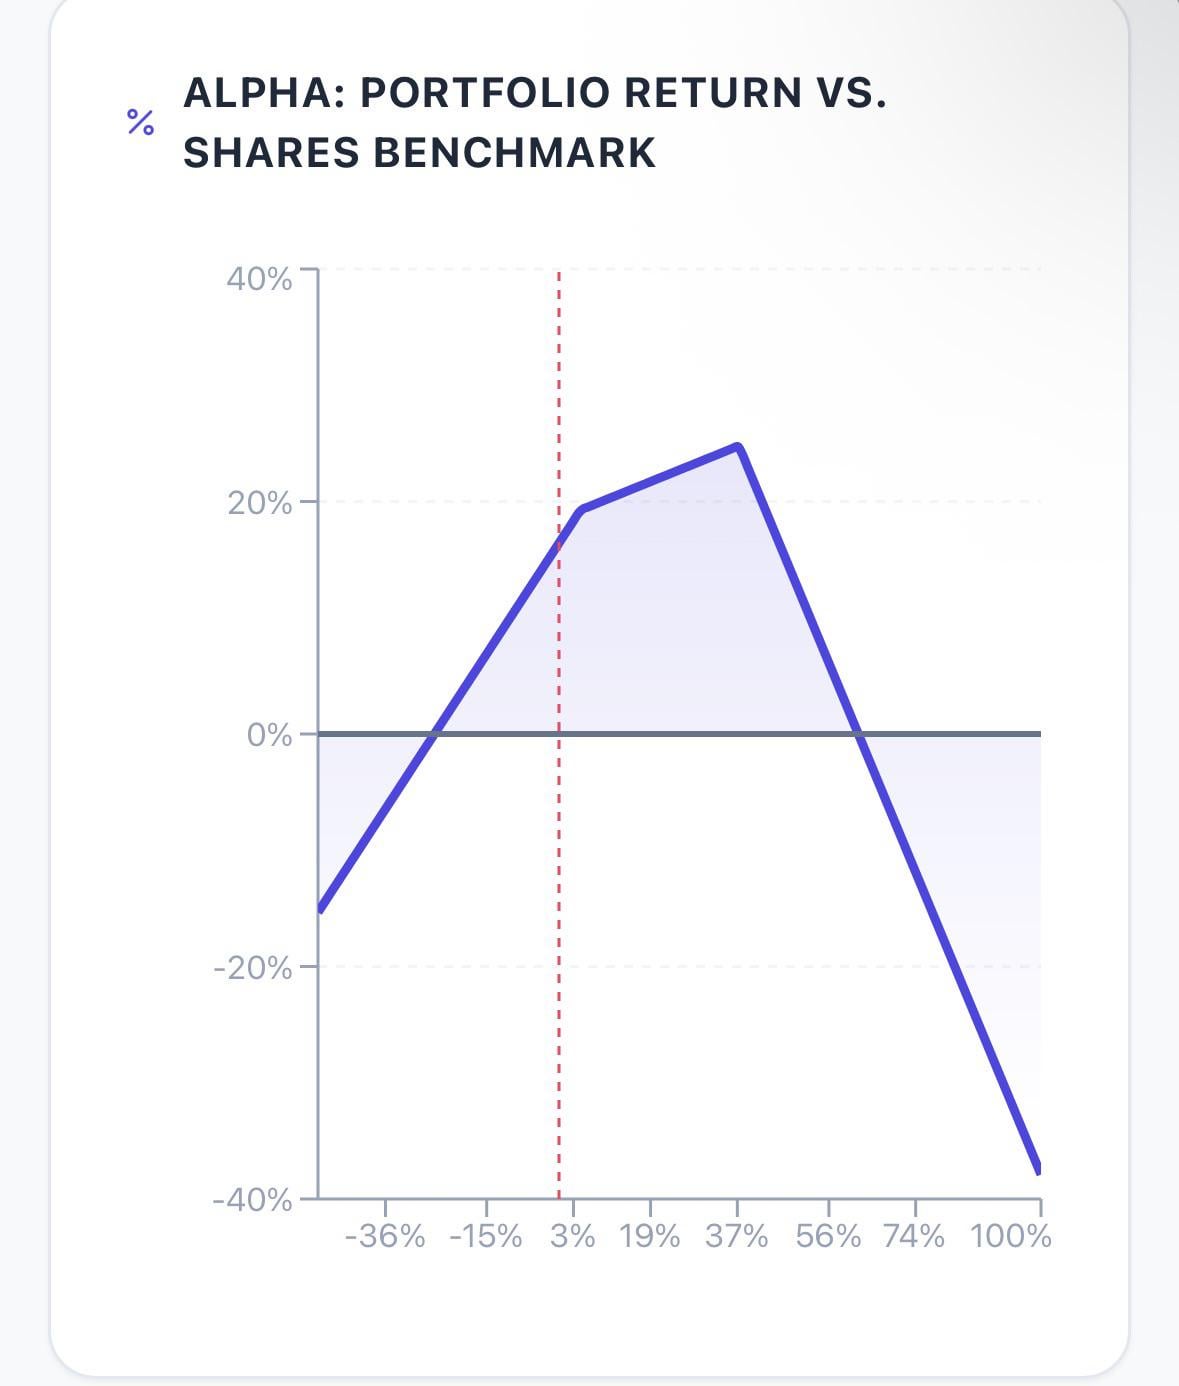
This is a model of where my covered cal/sold put strategy on UNH performs based on different UNH movements.
(Little margin, 500 shares, 5 sold calls, 2 sold puts)
Outperforms for most moderate size 1y moves, and is bullishly favored (which I’m bullish)
Outperforms when UNH goes down less than 20%, or up less than 60% within a year, anywhere outside of that, pure shares would have been best.
It fits my risk tolerance, etc. curious if anyone else models their stuff out visually now that the ai tools give us access to easily create visuals like this now.
If UNH stays flat, this strategy makes me 16.42%
Goes up 20%, I make 41%,
If UNH goes down 10%, I break even, (10% outperform, 0% net return)
If UNH goes down 20%, I only lose 16%,
Outside this range, it does worse, if UNH goes up 100%, I only make, 62.1%
If UNH goes down 50%, I lose 65%
Kinda cool seeing this visually
https://i.redd.it/kojv0r4m3udg1.jpeg
Posted by TheSmartest_idiot