
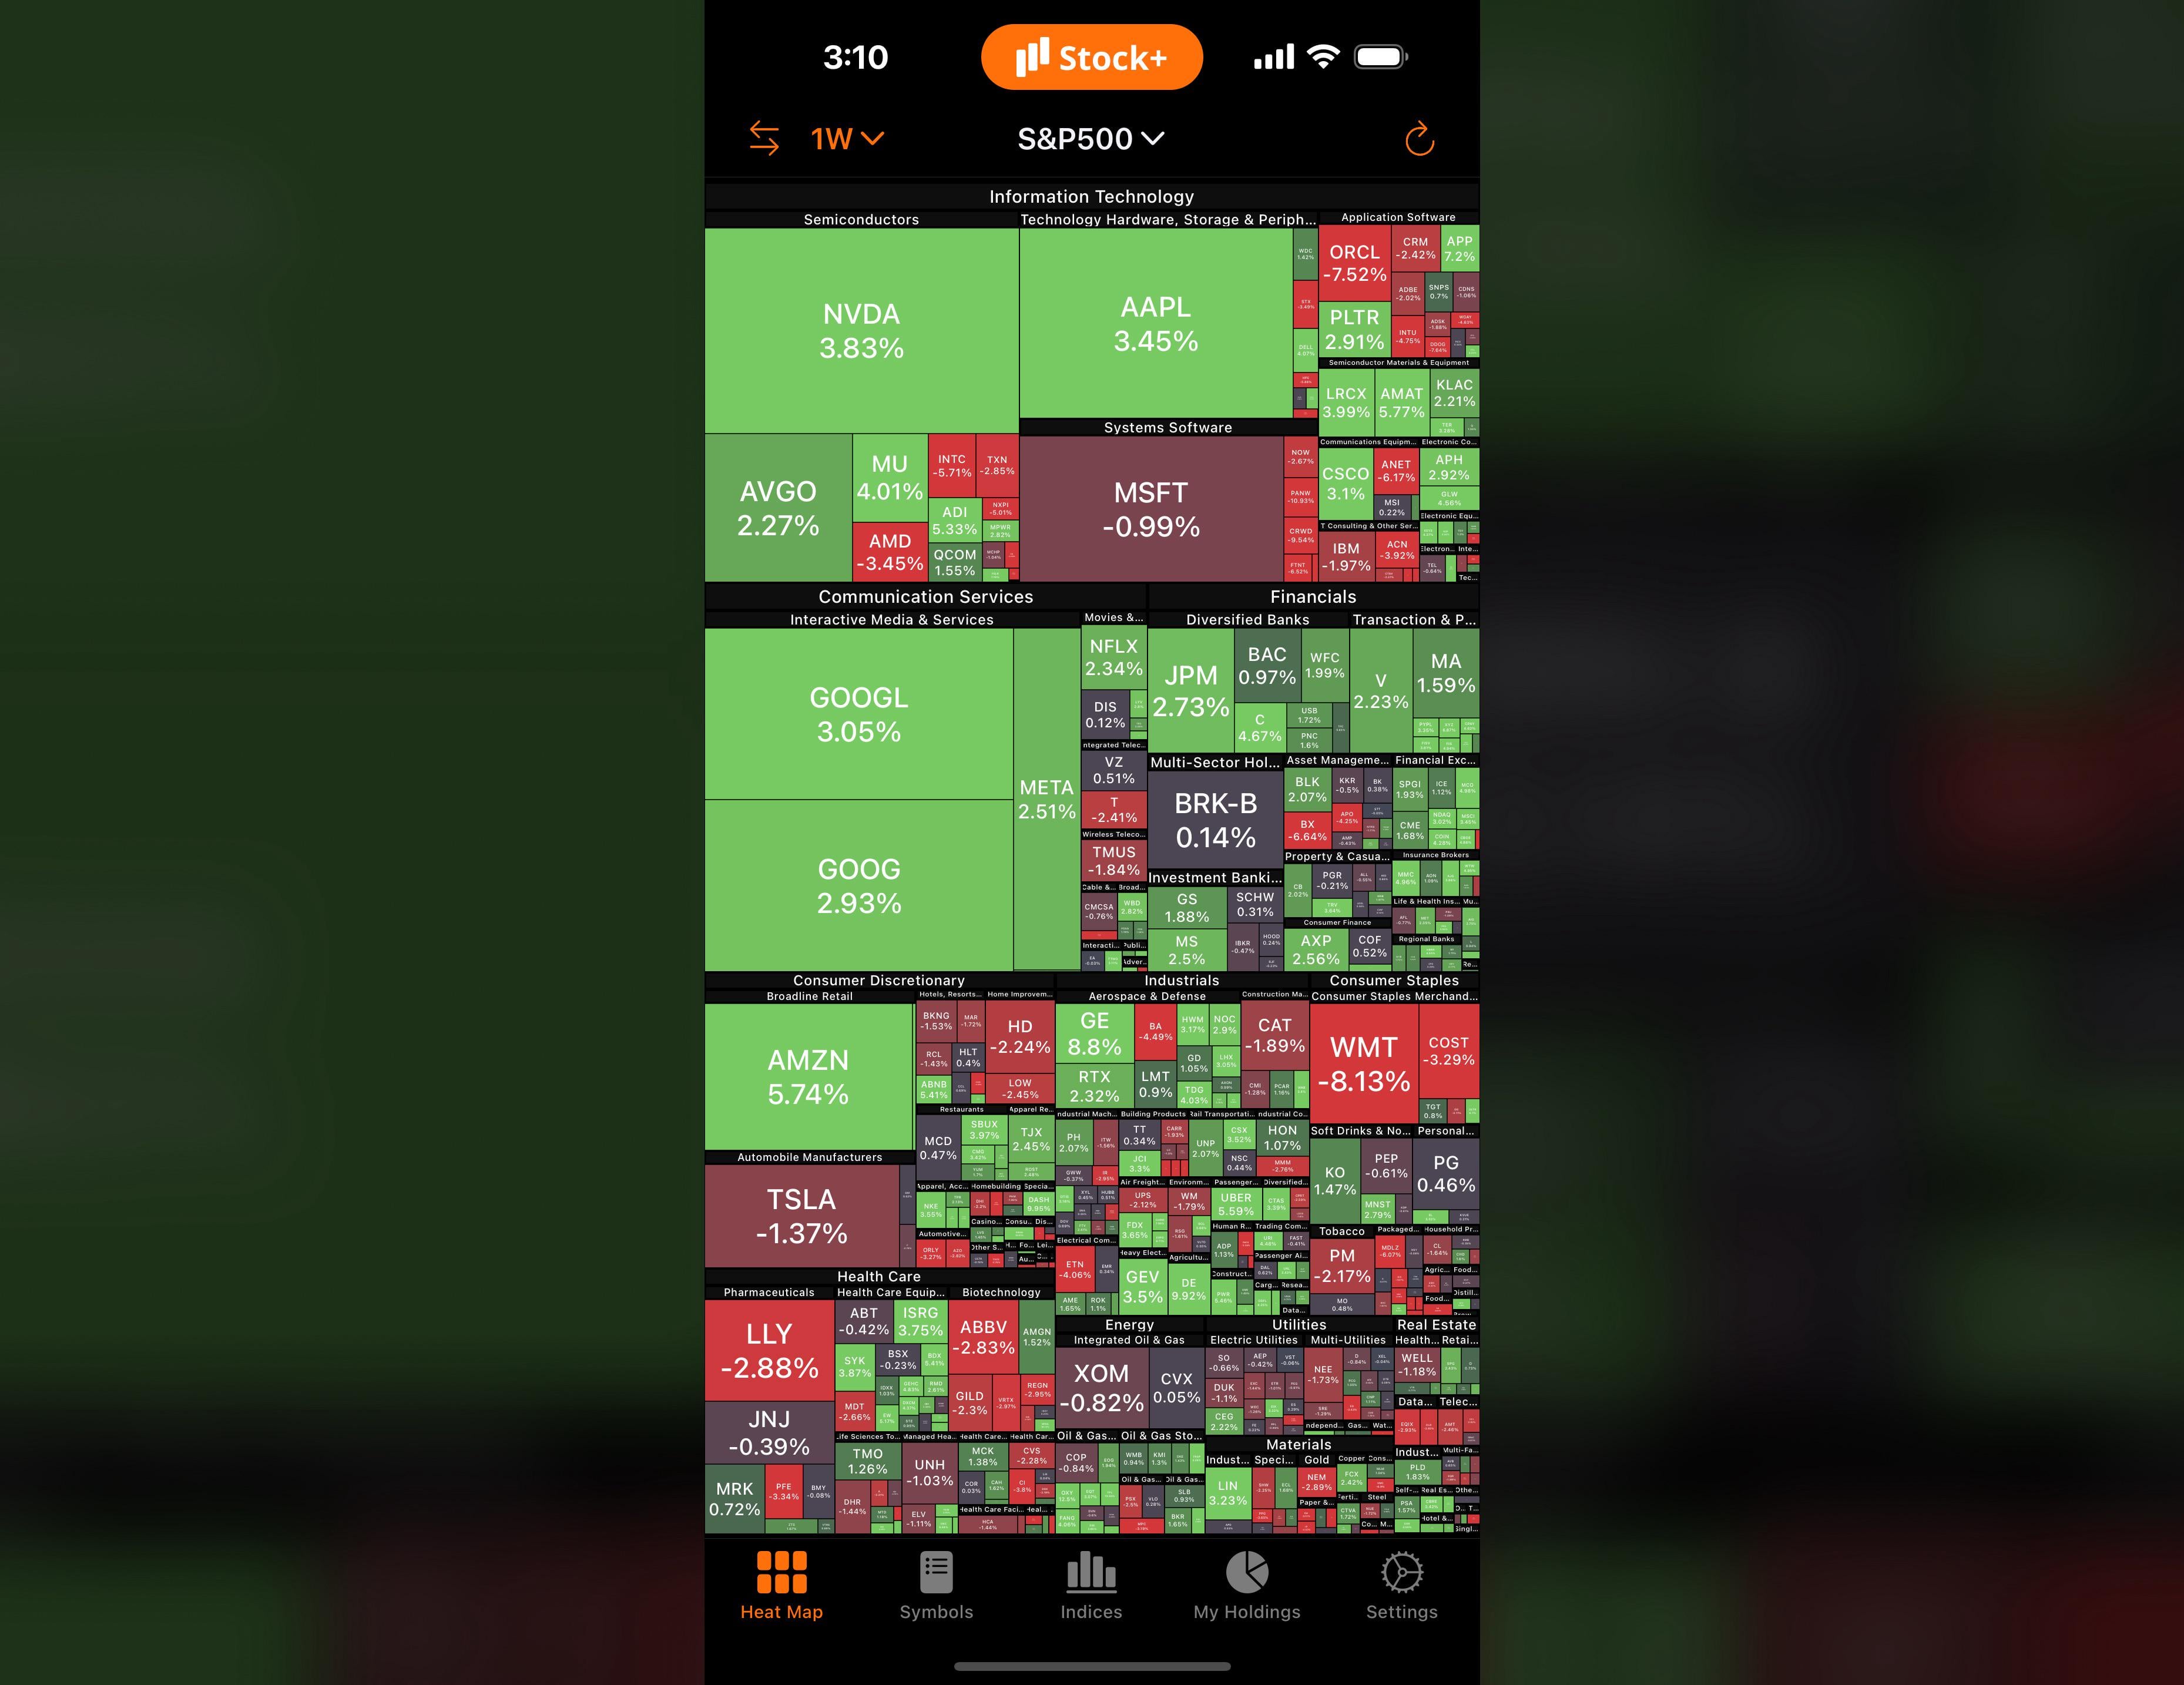
First of all, I don't want to be misunderstood. This heat map is weekly that it visualized via closing prices from February 13 to February 20.
📊 Here are the S&P 500's week-by-week results for the last 4 week,
January 23 close at 6,915.61 – January 30 close at 6,939.03 🟢 (0.34%)
January 30 close at 6,939.03 – February 6 close at 6,932.30 🔴 (-0.10%)
February 6 close at 6,939.03 – February 13 close at 6,836.17 🔴 (-1.39%)
February 13 close at 6,836.17 – February 20 close at 6,909.51 🟢 (1.07%)
Let's take a quick look at the market. After the 3-day holiday, the week began in red side. This week, China was in holiday which negatively effected commodities. On the other hand, US and Iran tensions are keeping alive to commodities. In Wednesday, the Fed minutes were released and showed to support a pause of rate cuts. Jobless claims came below expectations.
Friday was the most important day of the week. Q4 GDP released at 1.4% and below expectations of 3.0%. Core PCE inflation came at 3.0% and reached psychological threshold. It's highest value since Dec 2023. The Supreme Court rejected Trump's tariffs with 6-3 vote. Trump announced new 10% global tariffs. The stock market reacted positively and closed higher more than 0.5% in Friday.
The S&P 500 is still moving between 6,800 and 7,000 for 4-months. In Tuesday, it dropped below and then closed above. GDP grew 2.2% in 2025. Will the economy perform even better this year? CPI inflation was encouraging, but Core PCE inflation came above expectations. Will the Fed continue rate cuts?
What do you think? How was your week?
❓ Note: Many people have asked where screenshots come from in my previous posts. I'm using Stock+ on iPhone and iPad. You can find it on the App Store. If you're using Android, I'm now sure if it's available, but you can try searching "Stock Map" or "Heat Map".
https://i.redd.it/pf5tdpszt3lg1.jpeg
Posted by vjectsport
1 Comment
Weekend Recap*
Didn’t most of that happen once markets closed?