
Energy markets often react very quickly to headlines.
The first move tends to price the risk of disruption, especially around shipping routes and regional supply flows. Once the immediate fear cools down, the market usually enters a second phase where that premium starts to be reassessed.
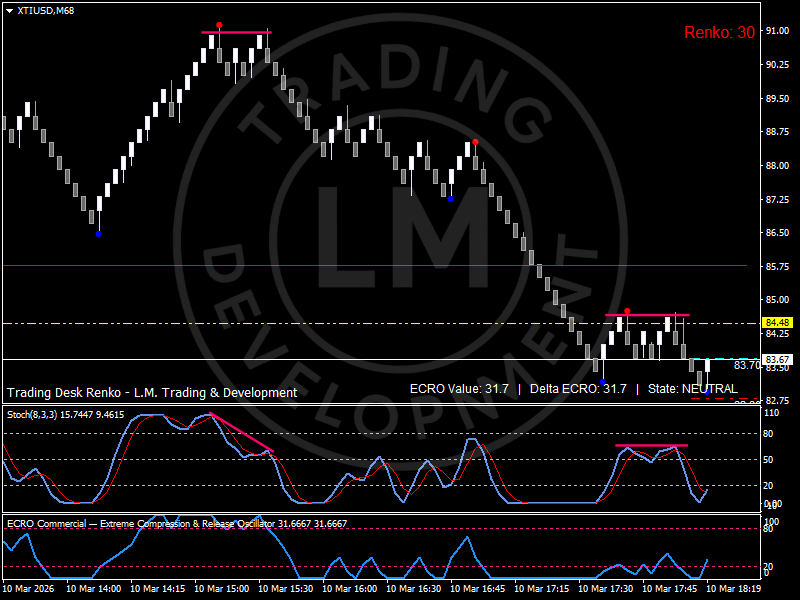
That is what the current structure in crude seems to reflect.
The Renko chart shows a clear directional leg lower after the spike. Momentum accelerated during the unwind and price moved back toward the mid-80s area, which now becomes the first zone where the market may attempt to stabilize.
Around 84–85 the structure begins to compress again. After a fast move lower this type of behavior often signals that traders are shifting from panic repricing to a phase of reassessment. The market is essentially trying to determine how much of the geopolitical premium should remain embedded in price.
When crude trades these cycles the first impulse is rarely the full story. Oil tends to spike quickly when risk appears and then spend several sessions digesting that move while positioning adjusts.
The current price behavior around the mid-80s therefore looks less like a clean collapse in the physical story and more like the market recalibrating the premium that had built during the rally.
Chart: Renko structure highlighting the unwind and the current stabilization zone.
For those interested in the broader commodities picture I wrote a short radar covering the current compression in silver and the cross-asset signals across metals and energy.
https://ecomodities.substack.com/p/commodities-radar-9-silver-compresses
It’s free and can be read directly without signup.
https://i.redd.it/y1u535nml8og1.png
Posted by LMtrades