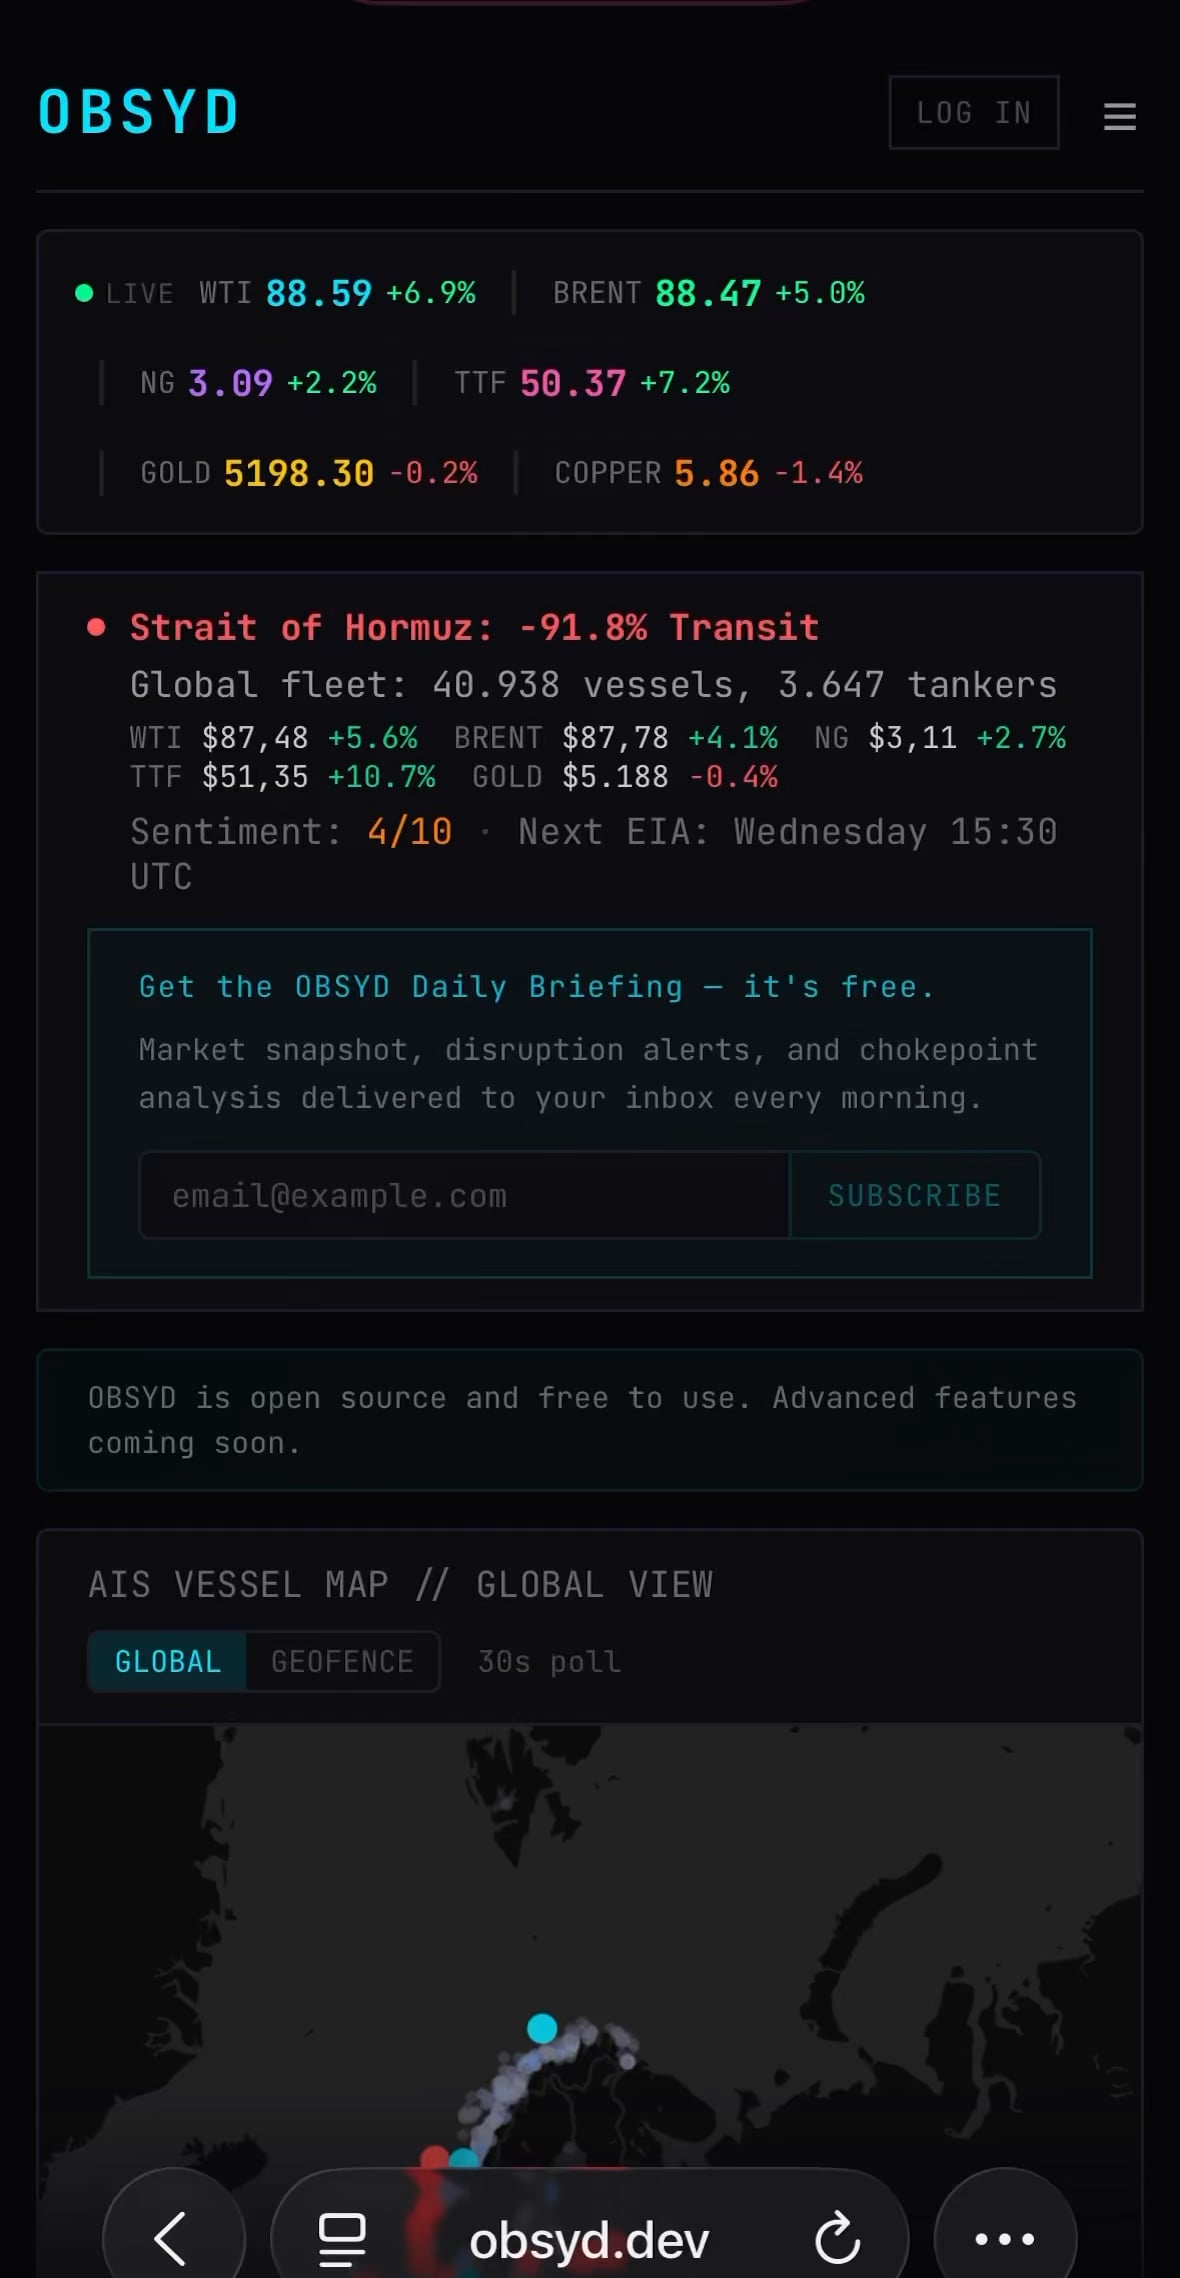
I added real-time disruption scoring and chokepoint analysis to my open-source energy dashboard — currently showing the Hormuz shutdown at -92%
I added real-time disruption scoring and chokepoint analysis to my open-source energy dashboard — currently showing the Hormuz shutdown at -92%
https://v.redd.it/vd50ko8bseog1
Posted by SpeakerOld4909
2 Comments
SpeakerOld4909 on
Built this to track chokepoint disruptions with free data.
Currently showing:
– Hormuz transit down 92% since Feb 28
– Cape rerouting at 44%
– Supply Disruption Index at 52/100 (HIGH)
– Crack spreads at 87th percentile vs 1 year
– EIA model signals inventory draw this week
– Days of Supply at 43.0 (in line with 5Y avg)
All data from AIS ship tracking, IMF PortWatch, and EIA.
Free and open source.

2 Comments
Built this to track chokepoint disruptions with free data.
Currently showing:
– Hormuz transit down 92% since Feb 28
– Cape rerouting at 44%
– Supply Disruption Index at 52/100 (HIGH)
– Crack spreads at 87th percentile vs 1 year
– EIA model signals inventory draw this week
– Days of Supply at 43.0 (in line with 5Y avg)
All data from AIS ship tracking, IMF PortWatch, and EIA.
Free and open source.
Live: https://obsyd.dev
What data would be useful that’s missing?
Awesome, working on a similar tool, you are way ahead of me.
Is there a repo on GitHub?