
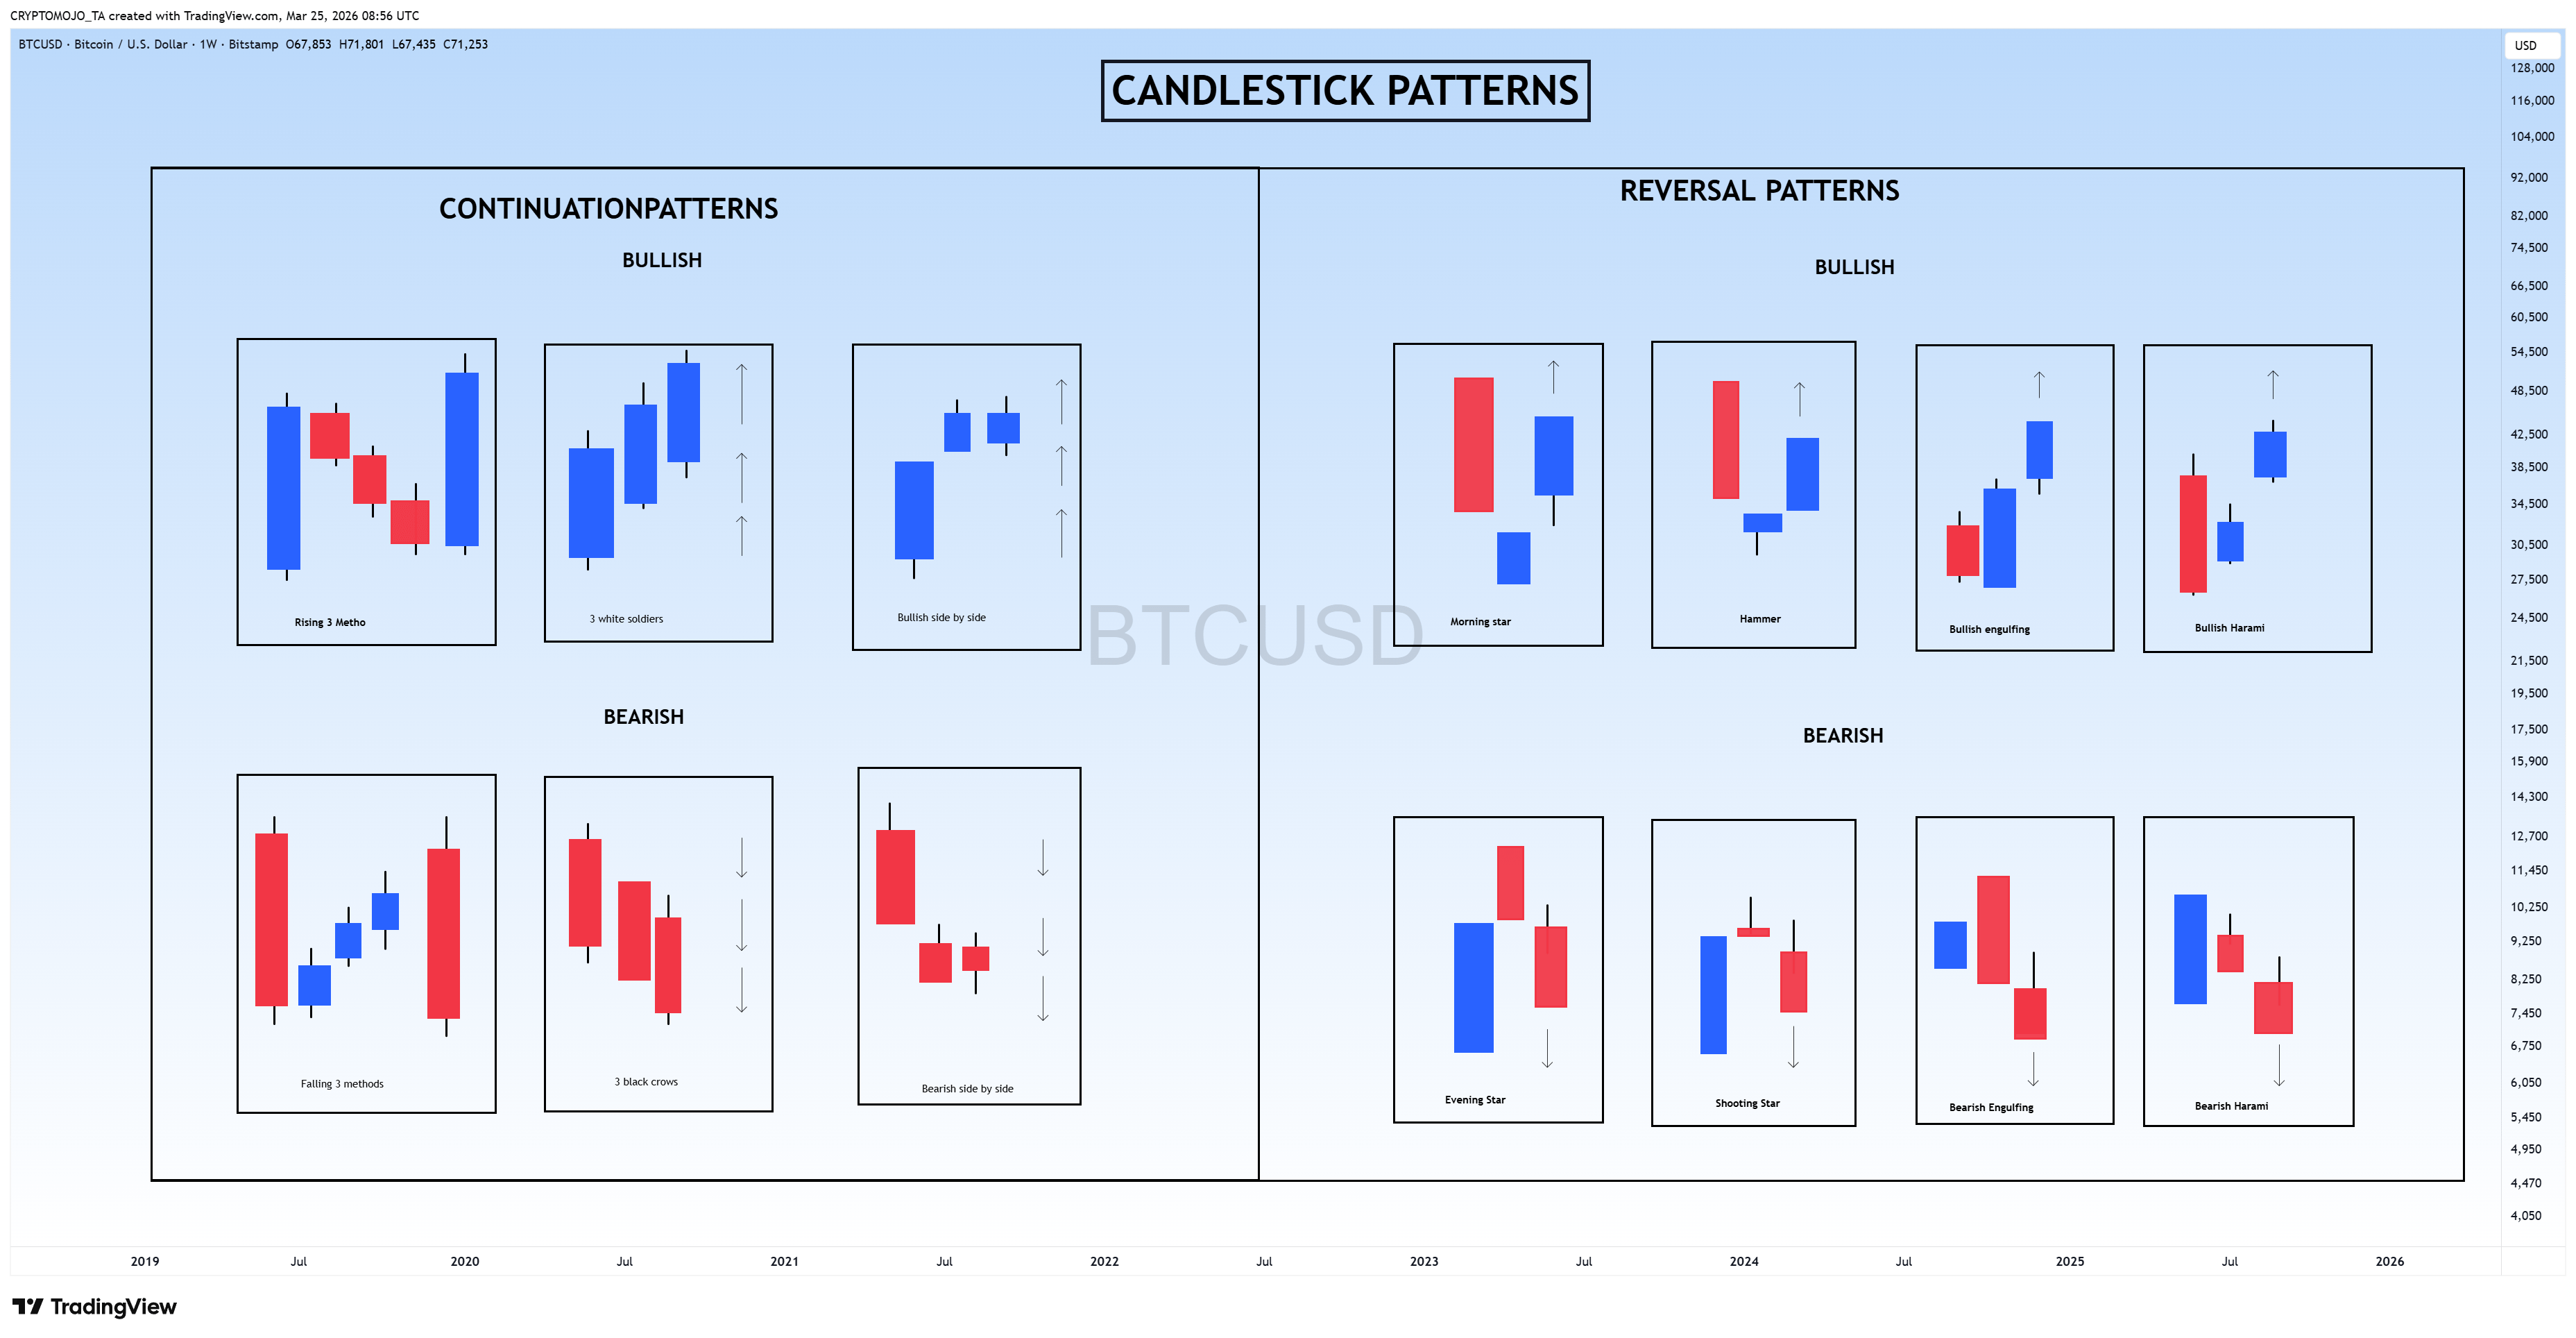
CANDLESTICK PATTERNS – COMPLETE BREAKDOWN & EXPLANATION
The chart you shared is a comprehensive visual guide to candlestick patterns, divided into two major categories:
Continuation Patterns
Reversal Patterns
These patterns help traders understand market psychology, momentum, and potential future price direction.
Let’s break down everything shown in the chart in detail 👇
🔵 CONTINUATION PATTERNS
Continuation patterns suggest that the current trend is likely to continue after a brief pause or consolidation.
🟢 BULLISH CONTINUATION PATTERNS
These appear during an uptrend and suggest the uptrend will resume.
1️⃣ Rising Three Methods
Structure:
1 strong bullish candle
Followed by 3 small bearish candles (consolidation)
Ends with another strong bullish candle breaking higher
Psychology:
Buyers remain in control. Sellers try to push price down but lack strength.
Signal:
Continuation of the uptrend.
2️⃣ Three White Soldiers
Structure:
Three strong bullish candles in a row
Each closes higher than the previous
Small or no lower wicks
Psychology:
Aggressive buying pressure. Strong trend confirmation.
Signal:
Strong bullish continuation.
3️⃣ Bullish Side-by-Side
Structure:
Strong bullish candle
Followed by small candles moving sideways
Breakout upward
Psychology:
Market pauses but buyers are still dominant.
Signal:
Uptrend continuation.
🔴 BEARISH CONTINUATION PATTERNS
These appear during a downtrend and suggest the downtrend will continue.
4️⃣ Falling Three Methods
Structure:
1 strong bearish candle
3 small bullish candles (weak pullback)
1 strong bearish candle breaking lower
Psychology:
Temporary relief rally, but sellers remain dominant.
Signal:
Continuation of the downtrend.
5️⃣ Three Black Crows
Structure:
Three strong bearish candles
Each closes lower than the previous
Small upper wicks
Psychology:
Strong selling pressure.
Signal:
Bearish continuation.
6️⃣ Bearish Side-by-Side
Structure:
Strong bearish candle
Small sideways candles
Breakdown downward
Psychology:
Sellers pausing before pushing price lower.
Signal:
Downtrend continuation.
🔁 REVERSAL PATTERNS
Reversal patterns suggest the trend may change direction.
🟢 BULLISH REVERSAL PATTERNS
These appear at the bottom of a downtrend and suggest price may rise.
7️⃣ Morning Star
Structure:
Large bearish candle
Small indecision candle (gap or small body)
Strong bullish candle closing deep into first candle
Psychology:
Sellers lose strength. Buyers step in aggressively.
Signal:
Downtrend reversing into uptrend.
8️⃣ Hammer
Structure:
Small body at top
Long lower wick
Appears after a decline
Psychology:
Sellers pushed price down, but buyers rejected lower prices.
Signal:
Potential bullish reversal.
9️⃣ Bullish Engulfing
Structure:
Small bearish candle
Large bullish candle fully engulfs previous candle
Psychology:
Buyers completely overpower sellers.
Signal:
Strong reversal to upside.
🔟 Bullish Harami
Structure:
Large bearish candle
Small bullish candle inside the previous candle body
Psychology:
Selling pressure is weakening.
Signal:
Possible trend reversal upward.
🔴 BEARISH REVERSAL PATTERNS
These appear at the top of an uptrend and suggest the price may fall.
1️⃣1️⃣ Evening Star
Structure:
Large bullish candle
Small indecision candle
Large bearish candle closing deep into the first candle
Psychology:
Buyers lose momentum. Sellers take control.
Signal:
Uptrend reversing into a downtrend.
1️⃣2️⃣ Shooting Star
Structure:
Small body at the bottom
Long upper wick
Appears after an uptrend
Psychology:
Buyers pushed higher but were rejected.
Signal:
Potential bearish reversal.
1️⃣3️⃣ Bearish Engulfing
Structure:
Small bullish candle
Large bearish candle fully engulfs the previous candle
Psychology:
Sellers overwhelm buyers.
Signal:
Strong bearish reversal.
1️⃣4️⃣ Bearish Harami
Structure:
Large bullish candle
Small bearish candle inside previous body
Psychology:
Buying pressure weakens.
Signal:
Possible reversal downward.
🧠 What This Chart Is Teaching
The chart is essentially teaching:
✔ Market Psychology
Candlesticks represent a battle between buyers and sellers.
✔ Trend Continuation vs Trend Reversal
Continuation = trend pauses, then continues
Reversal = trend direction changes
✔ Pattern Confirmation
Patterns work best:
At support/resistance
With volume confirmation
With trend context
On higher timeframes (like weekly)
⚠ Important Notes
No pattern is 100% accurate.
Always wait for confirmation.
Combine with:
Support & resistance
Trendlines
Moving averages
Volume
RSI / MACD
📈 Why This Matters (Especially for Crypto & BTC)
On volatile markets like BTC:
Continuation patterns help you ride trends.
Reversal patterns help you catch bottoms/tops early.
Weekly timeframe patterns are especially powerful.
🔥 Final Summary
This chart is a complete visual cheat sheet of:
• 6 Continuation patterns
• 8 Reversal patterns
• Bullish and Bearish versions
• Market psychology behind each formation
Mastering these patterns allows you to:
Understand price action deeply
Trade without relying only on indicators
Improve entry & exit timing
Candlestick patterns need to be one of your trading arsenal's most effective weapons. We can determine the direction of the market using several candlestick patterns. All timeframes exhibit these patterns, but the daily candlestick patterns seem to be the most reliable.
Once you recognize these patterns, you may be ready for your next move and use other tools to join the market, including the previously discussed MA approach and flag patterns (see attached charts). This chart is just for information
Never stop learning
I would also love to know your charts and views in the comment section.
Thank you
https://i.redd.it/g5dpuxiho5rg1.png
Posted by CRYPTOMOJO_TV