Built a gamma exposure heatmap that visualizes dealer positioning across every strike and expiration. Here's what SPY looked like heading into today's session.                                                      

      ▎ What the heatmap showed before the drop:                                                                                                                                                                             

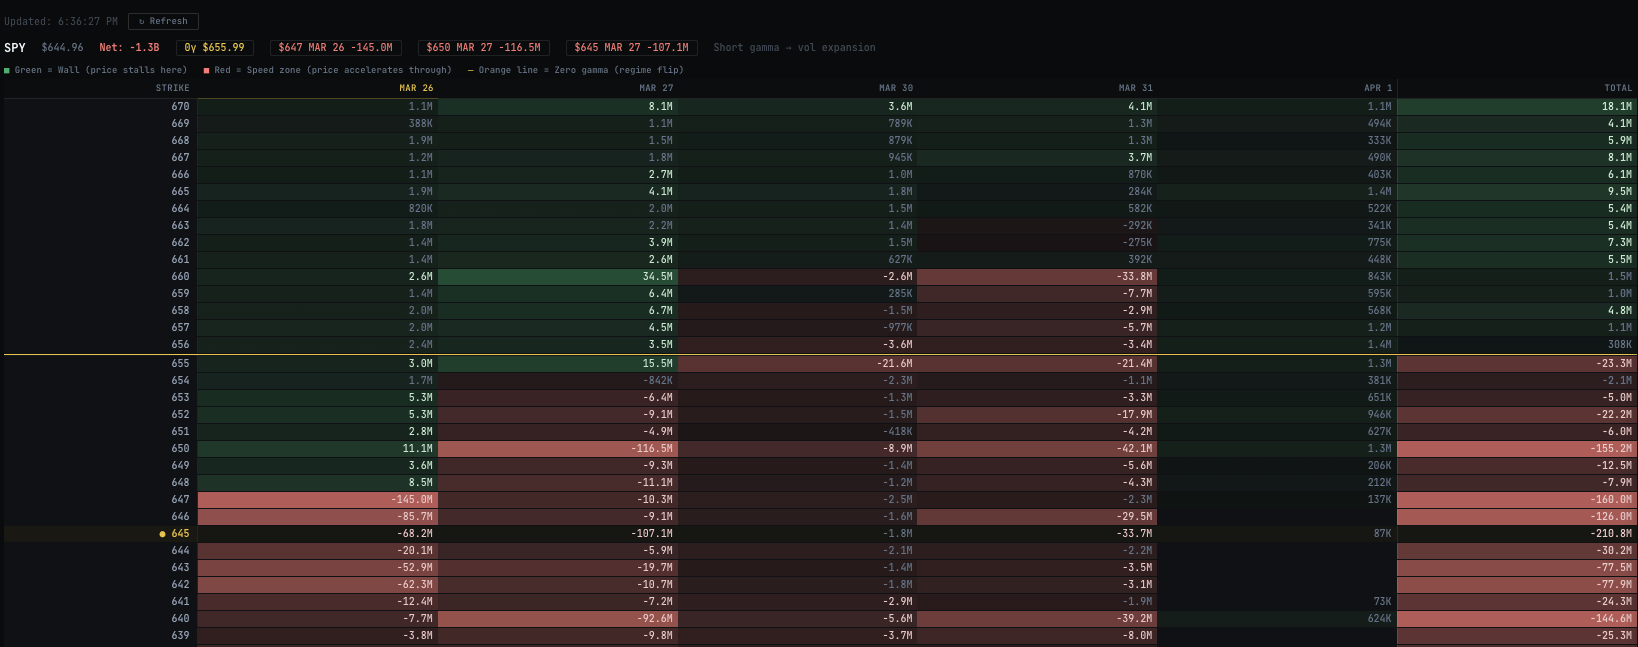
      ▎ – Zero gamma line at $655.99 — SPY opened right on it                                                                                                                                                                

      ▎ – Massive negative GEX below: -$21.6M at 655, -$116.5M at 650, -$145M at 647

      ▎ – Call wall at 660 with $34.5M positive GEX — ceiling                                                                                                                                                                

      ▎ – Below 655, nothing but red speed zones all the way to 640                                                                                                                                                          

      ▎ SPY dropped from 656 to 644. Every level it blew through was red on the map.                                                                                                                                         

      ▎ How to read it:                                                                                                                                                                                                      

      ▎ Green = dealer wall. They're long gamma at that strike so they buy dips and sell rips. Price stalls here.                                                                                                            

      ▎ Red = speed zone. Dealers are short gamma so their hedging amplifies the move. Price accelerates through these levels.                                                                                               

      ▎ Orange line = regime flip. Above it, dealers dampen moves (mean reversion). Below it, they amplify moves (trend/vol expansion).                                                                                      

      ▎ Why it matters:                                                                                                                                                                                                      

      ▎ The $650 strike had -$116.5M of GEX. That means when SPY approached 650, dealers were forced to sell more — accelerating the drop. This isn't TA or support/resistance. It's the mechanical result of options market 

      maker hedging.

      ▎ The -1.3B net GEX on the day meant short gamma across the entire board. Big moves were baked in before the open.                                                                                                     


      ▎ Happy to answer questions about the methodology.                                             

    https://i.redd.it/iqp06e8emhrg1.png

    Posted by Fondant_Cautious

    2 Comments

    1. Nice AI slop! Just what I needed. The misrepresentations of how GEX interacts with price is the cherry on top.

    Leave A Reply
    Share via