
This is my early stage historical analysis on my go to VRP credit spread selling strategy. I will be adding complexities and logic next but here are some interesting data nevertheless:
Dataset
- 18,307,256 spreads, one per (day × expiry × short_strike × width)
- 1,698 trading days, 2018-04-16 to 2026-04-02, 1,525 unique expiries
- Short delta 0.05 to 0.40, widths $1/2/3/5/10/20, strikes 75 to 105% of forward
- Theoretical: SVI surface gives IV at every strike, Black-Scholes converts IV to a dollar credit
- Realized: ASOF join each spread with actual SPY close at expiry
Every row has both sides. Theoretical credit, BS implied POP, EV. And the actual outcome at expiry.
Finding 1: every theoretical bucket is -EV
Flat vol BS average across all 18.3M spreads: -$0.48 per spread. No slice of the grid flips positive. That number is the skew premium the market charges for the long put wing. If this is the only model you look through, the conclusion is "don't sell put spreads." Flat vol BS can't see VRP or drift.
Finding 2: realized is positive almost everywhere
Average realized P&L: +$0.58. Realized edge (realized minus theoretical): +$1.06. Model POP 74.8%, actual winrate 92.9%, max loss rate 5.6%.
Yearly at width $5, 20-30 delta:
| Year | n | Theo EV | Realized | Edge | WR | ML |
|---|---|---|---|---|---|---|
| 2023 | 119,986 | -$0.43 | +$0.97 | +$1.39 | 97.8% | 1.2% |
| 2024 | 124,447 | -$0.47 | +$0.86 | +$1.33 | 97.5% | 1.8% |
| 2026 Q1 | 29,114 | -$0.57 | +$0.86 | +$1.43 | 97.0% | 1.9% |
| 2020 | 131,318 | -$0.51 | +$0.84 | +$1.35 | 95.6% | 3.7% |
| 2025 | 117,429 | -$0.54 | +$0.77 | +$1.31 | 96.3% | 3.1% |
| 2019 | 70,470 | -$0.40 | +$0.50 | +$0.91 | 89.8% | 8.3% |
| 2018 (Apr-Dec) | 46,479 | -$0.41 | +$0.28 | +$0.69 | 84.9% | 11.5% |
| 2021 | 129,952 | -$0.62 | +$0.21 | +$0.83 | 85.7% | 12.2% |
| 2022 | 108,386 | -$0.52 | +$0.02 | +$0.54 | 78.5% | 18.2% |
Every year profitable. 2022 was the near miss.
Finding 3: realized optimal entry is wide, deep, long dated
Top 6 by avg realized P&L (n ≥ 500):
|DTE||Δ||W|Realized|WR|ML|Edge|
|:-|:-|:-|:-|:-|:-|:-|
|91+|0.40|$20|+$3.85|87.7%|8.7%|+$6.21|
|91+|0.35|$20|+$3.61|89.8%|7.5%|+$5.88|
|91+|0.30|$20|+$3.23|91.6%|5.3%|+$5.33|
|91+|0.25|$20|+$2.80|93.6%|3.3%|+$4.71|
|91+|0.20|$20|+$2.09|95.1%|2.1%|+$3.72|
|91+|0.40|$10|+$1.96|86.7%|10.9%|+$3.22|
Long DTE captures drift, wide width scales dollars linearly. Per trade Sharpe in this top group is 0.57 to 0.65.
Finding 4: short DTE wins on annualized ROC, loses in practice
20-30 delta, $5 wide, by DTE bucket:
| DTE | Avg DTE | Credit | Max loss | Realized | Ann ROC | WR |
|---|---|---|---|---|---|---|
| 0-7 | 4.7 | $0.68 | $4.32 | +$0.042 | 75.3% | 83.1% |
| 8-21 | 14.4 | $0.74 | $4.26 | +$0.069 | 41.0% | 84.2% |
| 46-90 | 67.5 | $0.79 | $4.21 | +$0.255 | 32.7% | 88.5% |
| 22-45 | 32.5 | $0.76 | $4.24 | +$0.121 | 32.1% | 85.9% |
| 91+ | 394 | $1.06 | $3.94 | +$0.752 | 17.7% | 93.6% |
At 0-7 DTE 25 delta the credit is $0.07/share. Realistic commissions plus slippage eat most of that. The 75% ann ROC is a model ceiling, not clearable. The 22-90 DTE band at ~32% is the honest zone.
Finding 5: Sharpe ranking
IID annualization from the per trade distribution:
trades_per_year = 365 / avg_dte
ann_return_$    = avg_pnl × trades_per_year
ann_stddev_$    = sd_pnl × √(trades_per_year)
ann_sharpe      = ann_return_$ / ann_stddev_$
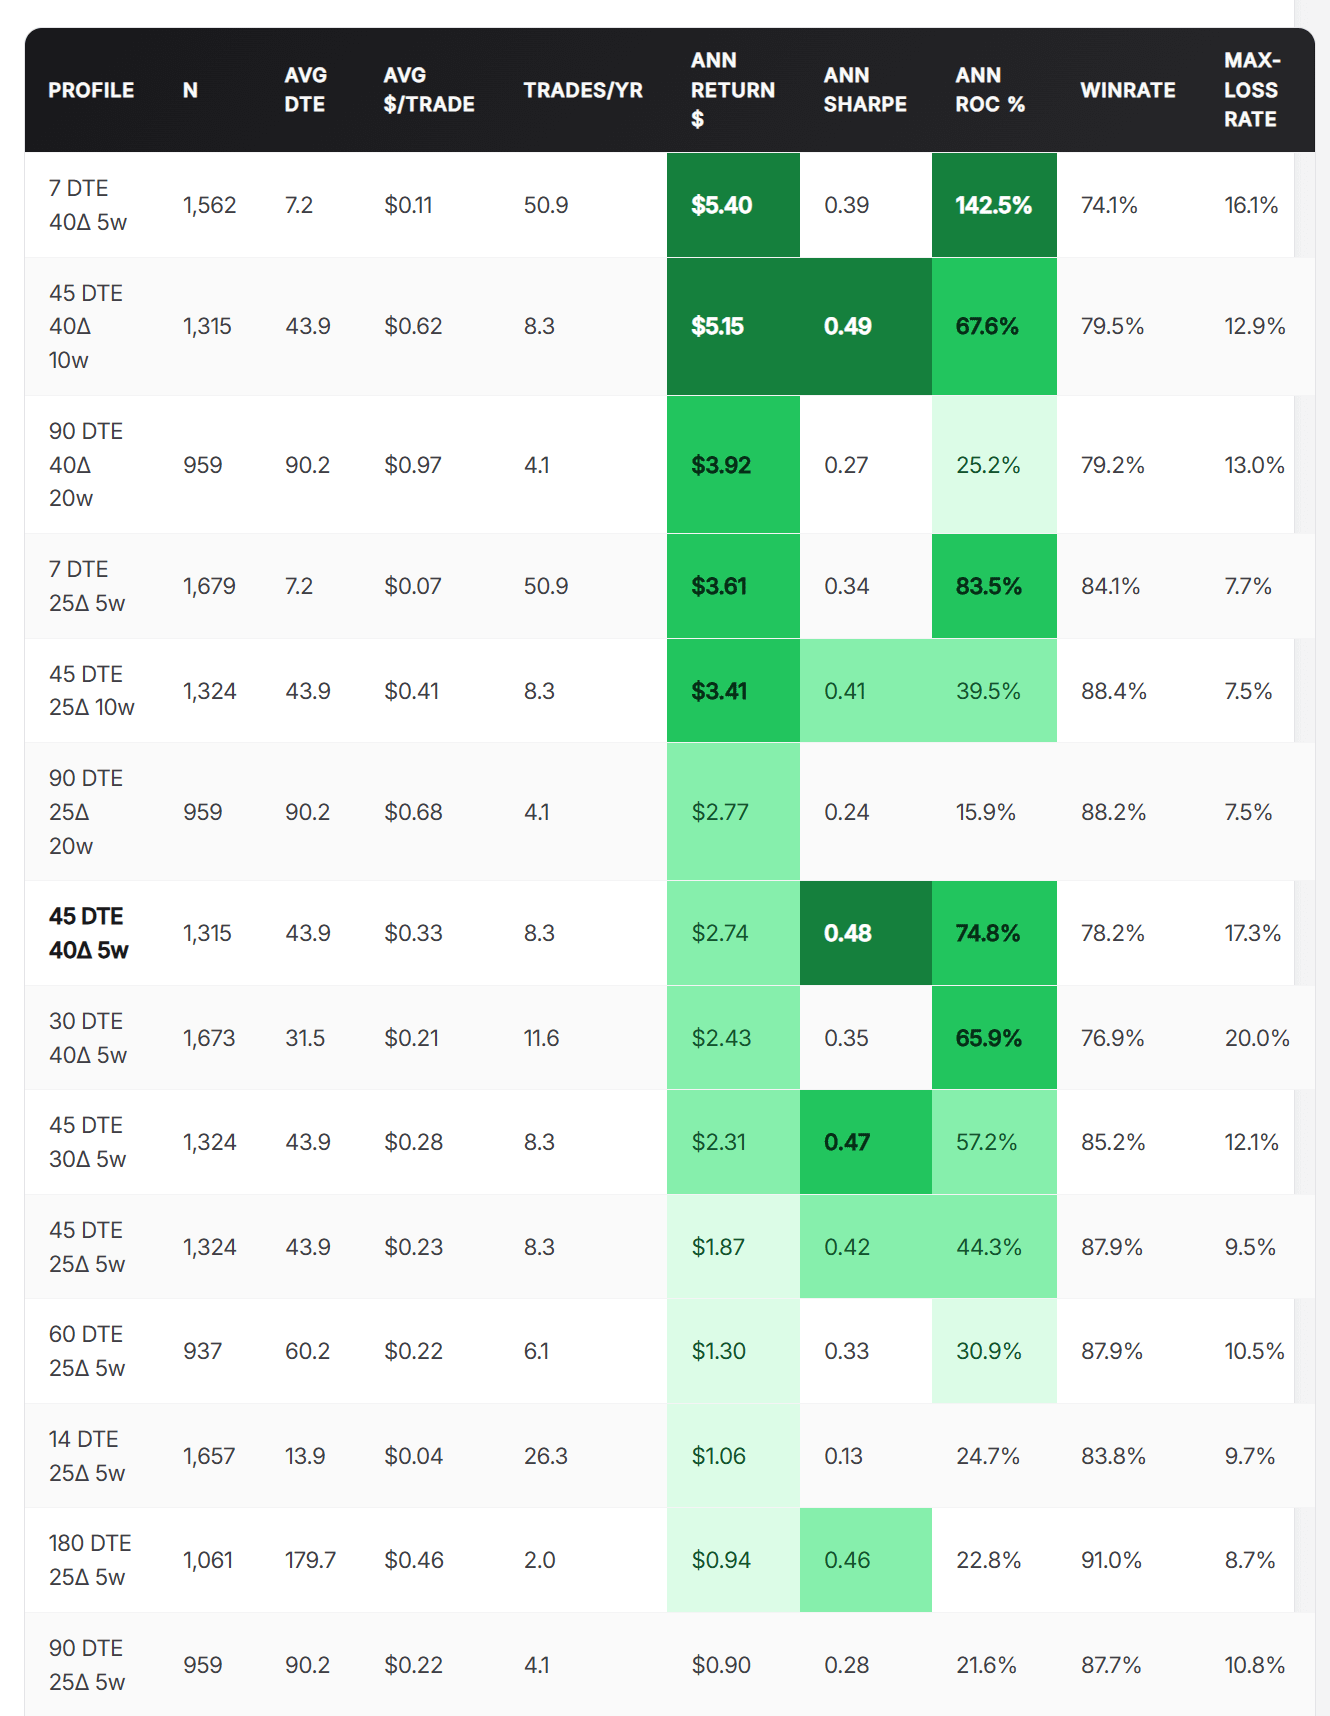
Sorted by annualized $:
| Profile | Ann $ | Sharpe | Ann ROC | WR | ML |
|---|---|---|---|---|---|
| 7 DTE 40Δ 5w | $5.40 | 0.39 | 142.5% | 74.1% | 16.1% |
| 45 DTE 40Δ 10w | $5.15 | 0.49 | 67.6% | 79.5% | 12.9% |
| 90 DTE 40Δ 20w | $3.92 | 0.27 | 25.2% | 79.2% | 13.0% |
| 7 DTE 25Δ 5w | $3.61 | 0.34 | 83.5% | 84.1% | 7.7% |
| 45 DTE 25Δ 10w | $3.41 | 0.41 | 39.5% | 88.4% | 7.5% |
| 45 DTE 40Δ 5w | $2.74 | 0.48 | 74.8% | 78.2% | 17.3% |
| 30 DTE 40Δ 5w | $2.43 | 0.35 | 65.9% | 76.9% | 20.0% |
| 45 DTE 30Δ 5w | $2.31 | 0.47 | 57.2% | 85.2% | 12.1% |
| 45 DTE 25Δ 5w | $1.87 | 0.42 | 44.3% | 87.9% | 9.5% |
| 180 DTE 25Δ 5w | $0.94 | 0.46 | 22.8% | 91.0% | 8.7% |
Three picks at 40 delta:
- Best risk adjusted: 45 DTE 40Δ $5w. Sharpe 0.48, ROC 75%. Capital $367/contract, annual $274, stddev $566.
- Biggest dollar yield: 45 DTE 40Δ $10w. Sharpe 0.49, ROC 68%. Capital $762/contract, annual $515.
- Frequency ROC: 7 DTE 40Δ $5w. 142% on paper but $0.11/share credit, costs eat most of it.
SPY buy and hold over 2018 to 2026 runs a Sharpe of about 0.55 to 0.70. Best put spread here (0.48) is competitive with passive SPY, not a free lunch. Real use case is diversification. Put spread P&L is theta and VRP, weakly correlated to daily SPY path.
$100k on 45 DTE 40Δ $5w, laddered: ~272 contracts, ~$74,500 expected annual P&L (74% ROC), stddev ~$154,000 (Sharpe 0.48). Under 2022 regime a $20-30k loss is in sample.
IID Sharpe overstates the real thing because losses cluster. When one spread hits max in a gap down, the other 271 in the ladder are on the same side. Realistic sizing is 25-50% of capital ($18-37k expected annual on $100k at controlled drawdown).
Finding 6: delta tradeoff at 22-45 DTE, $5 wide
||Δ||Realized|WR|ML|Credit|Theo EV|Edge|
|:-|:-|:-|:-|:-|:-|:-|
|0.40|+$0.202|76.5%|19.7%|$1.31|-$0.51|+$0.71|
|0.35|+$0.166|78.8%|17.3%|$1.15|-$0.49|+$0.66|
|0.30|+$0.132|82.1%|14.2%|$0.96|-$0.46|+$0.59|
|0.25|+$0.123|85.7%|10.9%|$0.77|-$0.42|+$0.54|
|0.20|+$0.110|89.2%|8.0%|$0.59|-$0.36|+$0.48|
|0.15|+$0.118|93.0%|4.9%|$0.42|-$0.30|+$0.42|
|0.10|+$0.110|96.5%|2.5%|$0.26|-$0.22|+$0.33|
|0.05|+$0.083|98.4%|1.3%|$0.16|-$0.16|+$0.24|
Absolute P&L climbs all the way to 40 delta. 40Δ collects ~2.4x the credit of 10Δ at 8x the max loss rate. Realized edge grows monotonically with delta. Market charges most skew ATM and that's where drift + VRP pay you back hardest. One in five 40Δ trades hits full max loss.
Finding 7: IV regime (counter intuitive)
Same 22-45 DTE, 20-30 delta, $5 wide footprint, bucketed by short strike IV:
| Regime | Theo EV | Realized | Edge | WR | ML | n |
|---|---|---|---|---|---|---|
| crisis (30+) | -$0.42 | +$0.54 | +$0.95 | 92.8% | 6.1% | 15,555 |
| high (22-30) | -$0.42 | +$0.16 | +$0.59 | 86.3% | 10.6% | 26,486 |
| elevated (16-22) | -$0.42 | +$0.05 | +$0.47 | 85.1% | 11.5% | 30,132 |
| normal (12-16) | -$0.38 | -$0.10 | +$0.28 | 81.7% | 13.1% | 17,848 |
| calm (<12) | -$0.37 | -$0.66 | -$0.30 | 71.3% | 22.6% | 1,676 |
Calm is the worst regime. Crisis is the best. Theoretical EV is nearly flat, realized flips from -$0.66 to +$0.54. In crisis, IV overshoots realized by the widest margin, so you're selling into the fear and reality comes in below what the market priced. In calm, small credits plus complacency get picked off when the regime flips. Calm sample is small (1,676) but the direction lines up with other VRP work. Low VIX is not the same as safe.
Finding 8: 2022 stress test
Only real bear year. Width $5, 20-30 delta went:
- WR: 85.7% → 78.5% → 97.8%
- Max loss: 12.2% → 18.2% → 1.2%
- P&L: +$0.21 → +$0.02 → +$0.97
Survived but with no margin. Any leverage would have been a double digit drawdown. This is the "how much discipline on sizing" question. In every other year the answer is "almost never." In 2022 it was "every trade."
Caveats
- No transaction costs. Short DTE not clearable. At 7 DTE 40Δ avg credit is $0.11/share, round trip costs eat $0.10-0.20.
- Theoretical = mid quote proxy (SVI + BS), not live bid/ask. Executable credit closer to bid.
- No liquidity filter. Thin strikes included whether they'd fill or not.
- No stops, no PTs. All held to expiry. 50% PT + -200% stop changes the distribution.
- IID Sharpe is an upper bound. Losses cluster in bear regimes. Real stddev wider than IID suggests.
- SVI calibration survivorship. Extreme tape tearing days under represented.
- SPY only. Structural drift. Single names (no drift, fat tails) would look materially worse.
- 8 years, 1 bear regime. Crisis regime conclusions and Sharpe estimate carry wide CIs.
None of these break the shape. They push magnitude down once live frictions hit.
TL;DR
Flat vol BS prices every SPY put credit spread at -$0.48 EV (skew premium). Realized averages +$0.58. The +$1.06 gap is VRP plus SPY drift that flat vol can't see.
Sharpe ceiling on any single profile is ~0.48 to 0.49 (45 DTE 40Δ wide). Competitive with SPY buy and hold, not a free lunch. Real value is low correlation. Diversifier, not replacement.
Full writeup with heatmaps: https://flashalpha.com/articles/spy-put-credit-spread-matrix-8-year-backtest-theoretical-vs-realized
Happy to rerun any profile. Drop (DTE, delta, width) in comments.
https://i.redd.it/4jq4tl3vdpwg1.png
Posted by FlashAlphaLab