
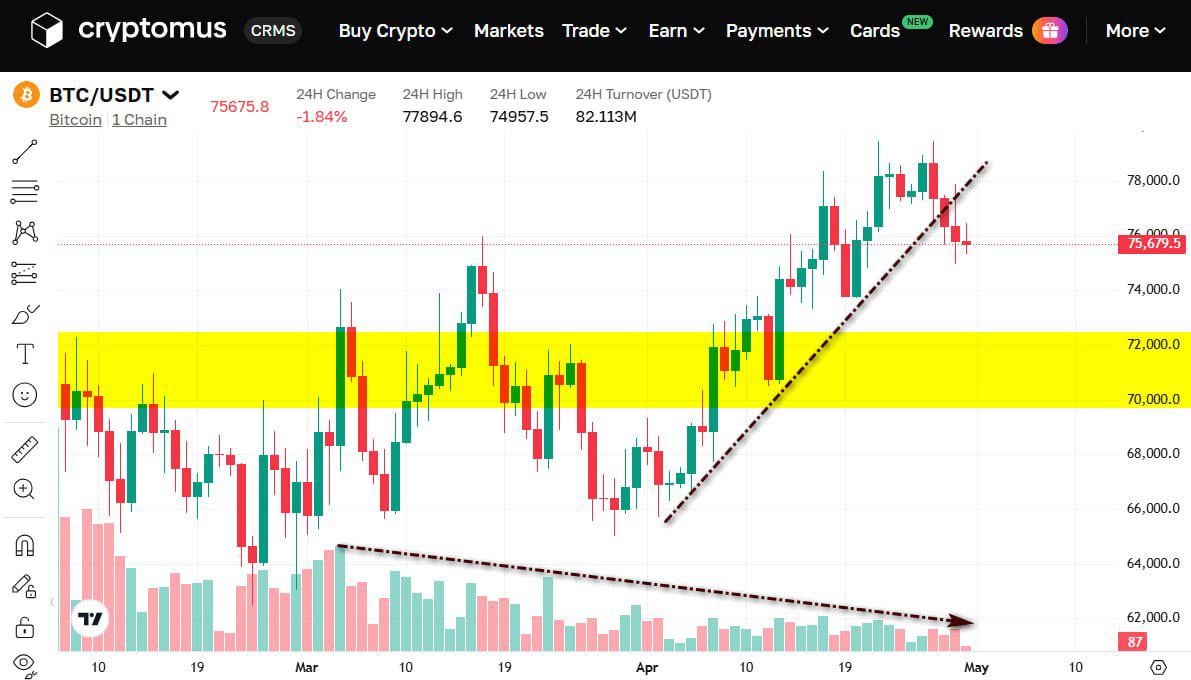
Yesterday's breakdown of Bitcoin's rising trend support line on the daily chart could turn into a serious correction — for both obvious and less obvious reasons. Basic technical analysis tells us that a few candle closes below the trend line are enough to confirm a breakout.
Every trend needs to go through a correction phase before it can push higher, but in the current setup, this breakdown has a real shot at turning into a full-on sell-off. On the Ethereum blockchain, there's been a sharp drop in active addresses using stablecoins. The weekly moving average has fallen 35% from its peak of 550K wallets — and that number covers all dollar-pegged ERC-20 tokens.
Stablecoins are the fuel that drives Bitcoin's rallies, something Nouriel Roubini pointed out back in 2018. The shrinking wallet count signals a collapse in trader activity. That same story shows up in Ethereum's on-chain data — trading volume histograms have dropped two to three times compared to Q1 figures.
My first downside target is the $72K–$70K resistance zone. That level will act as a Rubicon — if it breaks, hopes for a Bitcoin rally through the summer are essentially gone. By that point, Kevin Warsh may be in a position to revisit the question of a Fed rate cut.
https://i.redd.it/qknrax7k2ayg1.jpeg
Posted by tornavec