
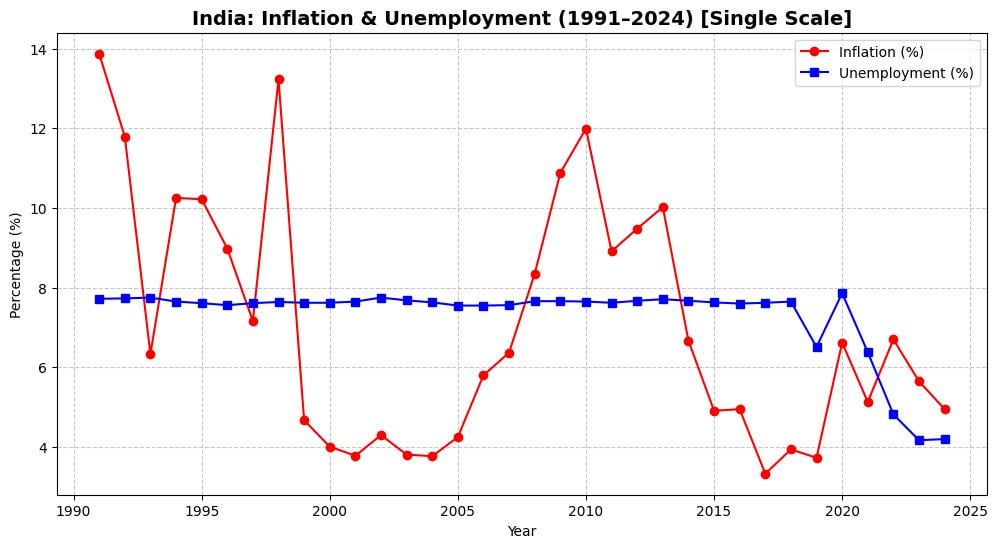
This chart plots India’s CPI inflation and unemployment from 1991 to 2024.
Unemployment was remarkably steady till 2018. On the World Bank modeled series, India’s unemployment rate hovered in a narrow band for nearly three decades, far more stable than inflation before pandemic-induced volatility.
Changes in inflation don’t pair with opposite moves in unemployment. In other words, the simple inverse inflation-unemployment tradeoff you would expect from a textbook Phillips curve isn’t visible here.
A possible reason why the Phillips curve doesn’t fit India might be the fact that India’s inflation is heavily shaped by food and energy shocks (monsoons, oil), not just demand. IMF work on India shows inflation dynamics dominated by these supply components within a New Keynesian Phillips curve framework. RBI research has even argued that food inflation displays “corelike” properties in that it is persistent, with spillovers to other prices. When supply shocks drive prices, the unemployment linkage weakens.
With roughly a high percentage of workers in informal or nonregular employment, the headline unemployment rate misses underemployment and disguised slack, especially in the agricultural sector. That makes unemployment a poor stand-in for demand pressure, flattening any inflation-unemployment relationship.
Source of data: World Bank | kuinbee.com
https://i.redd.it/d8by0mmff4lf1.jpeg
Posted by Kuinbee00