
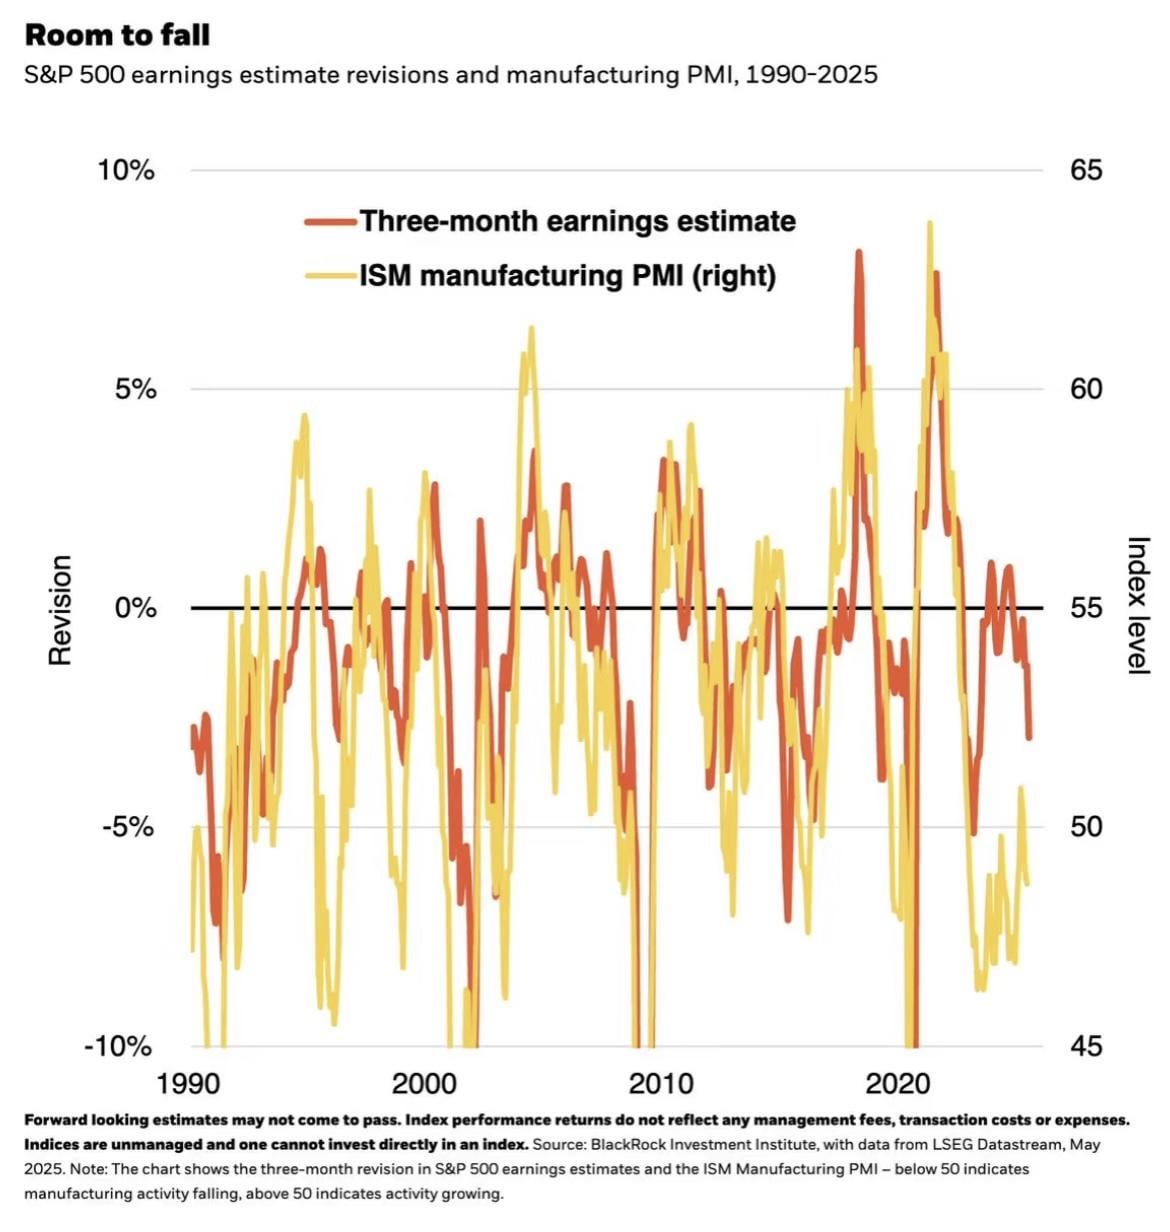
1️⃣ This chart tracks the historical relationship between 3-month forward earnings revisions for the S&P 500 and the ISM Manufacturing PMI, covering the period from 1990 to 2025.
2️⃣ The yellow line represents the ISM Manufacturing PMI. A reading below 50 signals contraction in manufacturing activity, while above 50 indicates expansion, making it a key leading indicator of economic health.
3️⃣ The red line represents the 3-month revision rate of S&P 500 earnings forecasts, which measures analysts’ adjustments to corporate profit expectations. Negative values reflect downward revisions.
Historically, there has been a strong positive correlation between the ISM PMI and S&P 500 earnings revisions, with both indicators moving in close alignment. Currently, both PMI and earnings revisions are trending lower, suggesting potential downside risks to corporate profits ahead. Investors should remain alert to market risks.
Source: BlackRock Investment Institute
The end, for the recent stock market, watch closely on NVDA, OSCR, BGM, HOOD, PLTR
https://i.redd.it/jkhi6dyow8pf1.jpeg
Posted by North_Reflection1796
1 Comment
Who comes up with this shit, seriously?
Although this may be true the bull market will not crash until the baby boomers die out, so we should be good for several years, maybe decades