
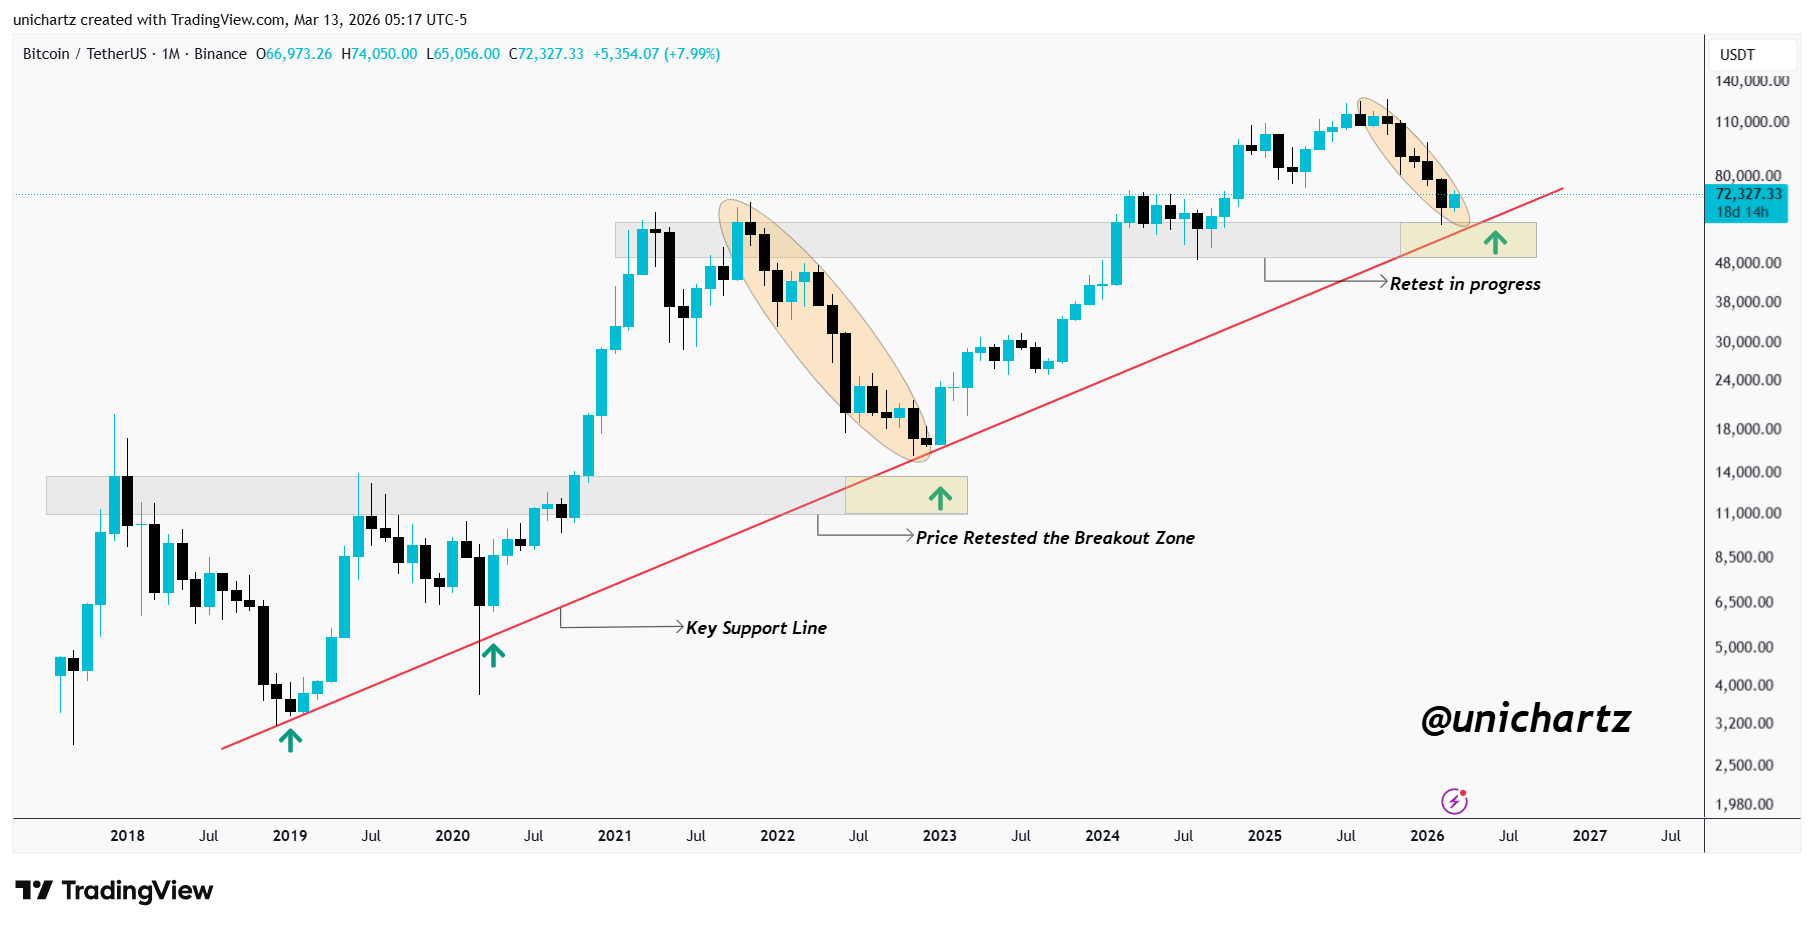
Looking at the 1-Month (1M) timeframe, there is a very clear structural pattern that has defined Bitcoin’s growth since the 2017-2018 cycle. While the daily charts are volatile, the macro trend remains remarkably consistent.
1. The Multi-Touch Macro Support (2018–2026) The ascending support line connecting the 2018/2019 lows has been tested multiple times. Each touchpoint, 2020, 2022, and now late 2025/early 2026, has historically marked the "floor" of the market. We are currently interacting with this diagonal support once again.
2. Identifying the S/R Flip The previous resistance zones from 2021 (the $50k-$60k range) have now been converted into a support floor. This "Breakout and Retest" confirms that the previous "ceiling" is now the "ground."
3. The "Retest in Progress" Phase We are currently witnessing a textbook re-accumulation. Historically, when the 1M candle closes and holds above these previous cycle highs, it solidifies the base for the next phase of the cycle.
Discussion: I’m curious how others are viewing this high-timeframe structure. Does the presence of institutional ETF flows change how we should interpret these historical "retests," or is Bitcoin simply following its established mathematical rhythm?
A Quantitative Look at Bitcoin’s Monthly (1M) Structure: The 7-Year Macro Floor and Support/Resistance Flips
byu/UniChartz inbtc
Posted by UniChartz