
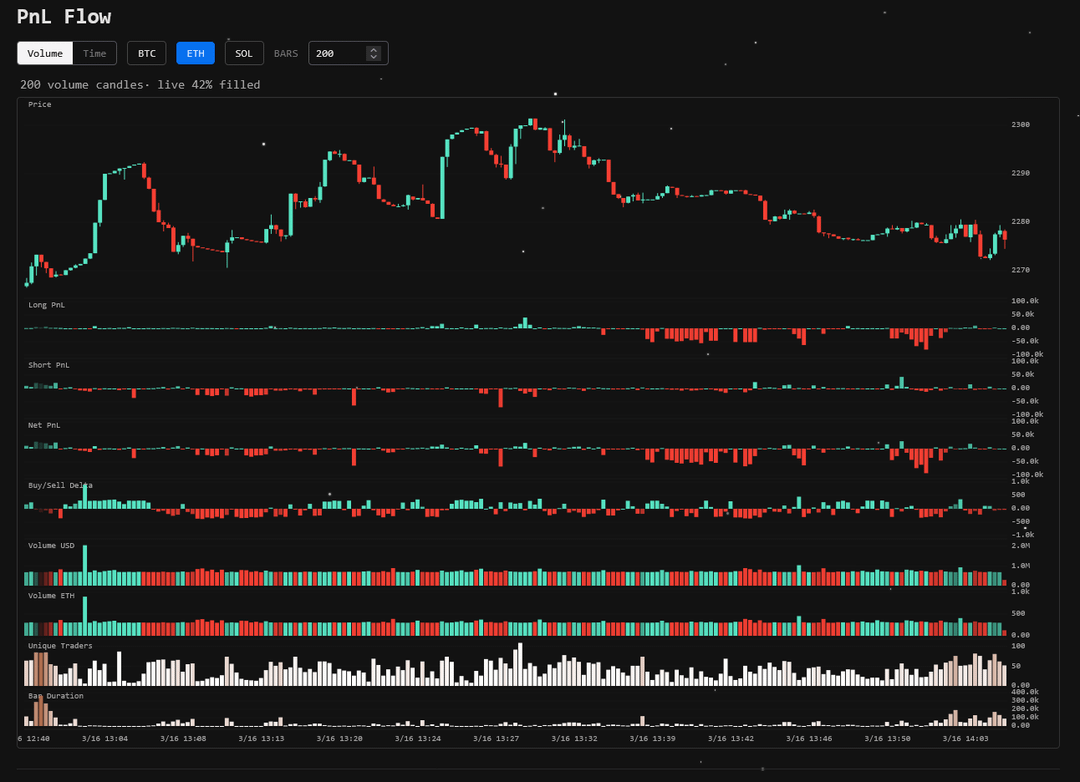
The first chart is $ETH, the first row is Long PnL the second is Shorts for every 300 ETH.
Shorts and Long, ETH looks like a sea of pain trading here. I checked out a few who closed, they have held positions from late January, but a couple of others just tried to scalp high leverage.
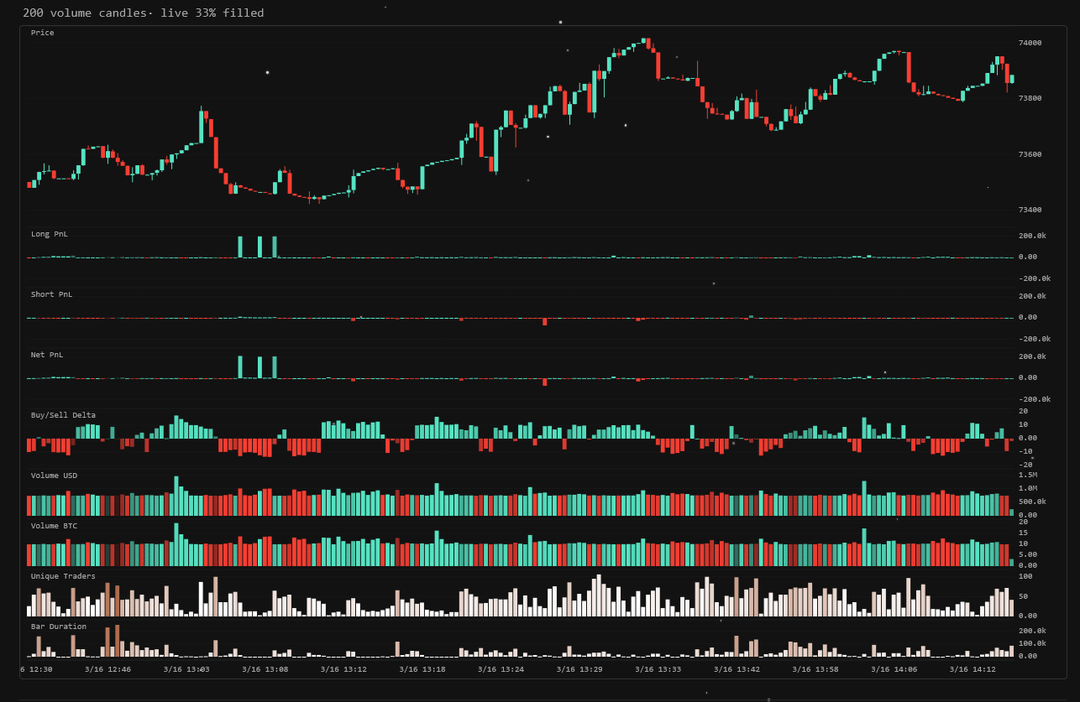
Bitcoin looks quite different, pnl is more or less break even. I'm guessing a couple of trailing stops got hit during the minipump a few hours ago.
https://www.reddit.com/gallery/1rv9iho
Posted by obolli
1 Comment
Sucks for them, good for us.