
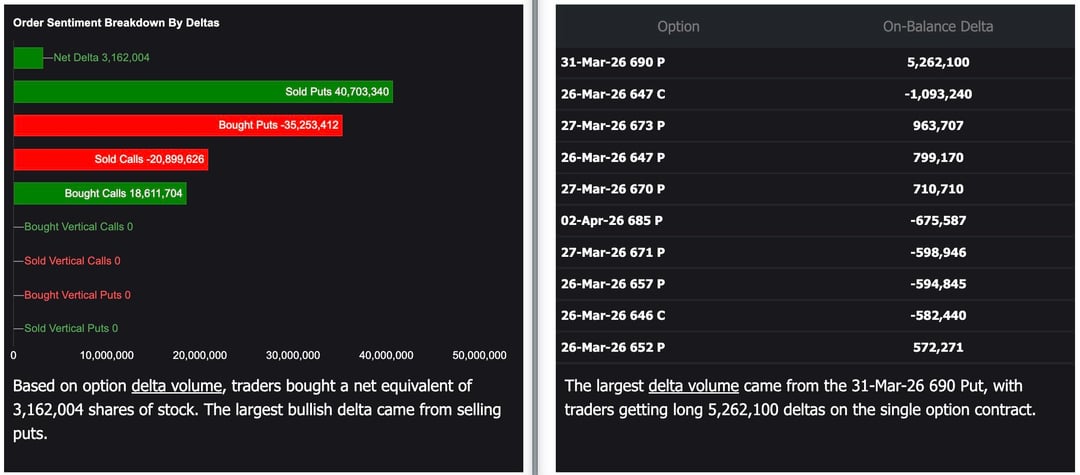
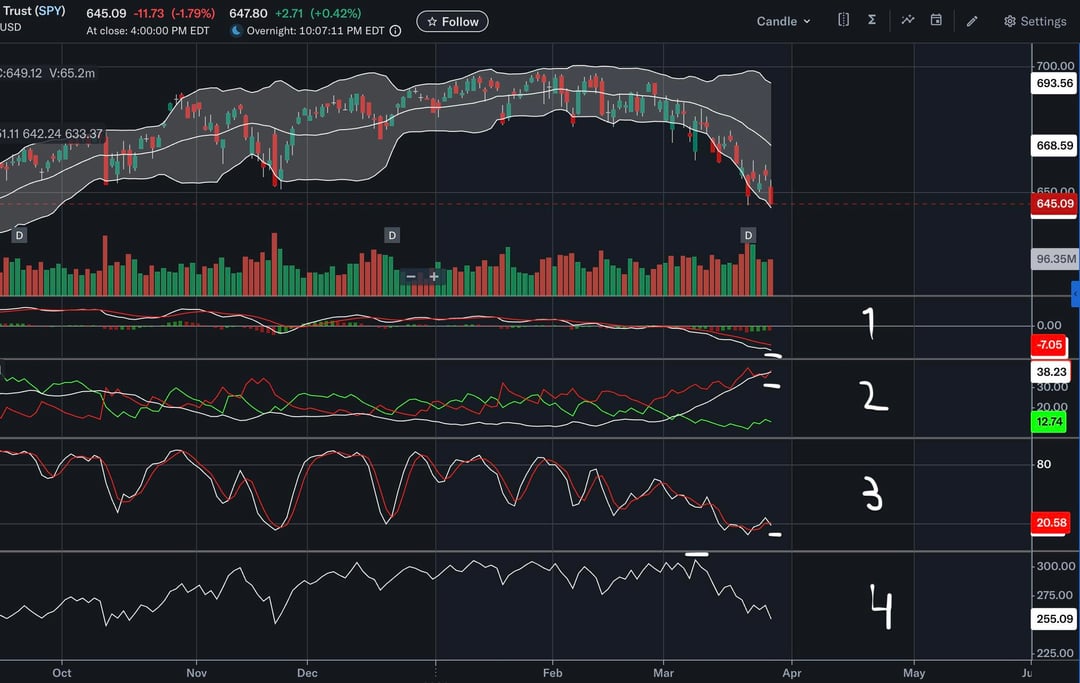
I’m preparing for a green day tomorrow, but it seems like the market is divided. What’s interesting to me is the heavy selling of 690P and the 647C at different expiration… doesn’t seem like a strategy that I’m familiar with. Combing that with this data point – single leg percentage @ 83% and multi leg @ 17% – it looks like to me some people are very confident on a green gap up. Am I missing something? Second chart are the indicators I use (not giving up my secret sauce so referring to each indicator by number).
Indicator 1) white line below signal line and both lines below 0 with negative (but minor) slope indicating momentum is continuing downward
Indicator 2) interpreting this as trend is continuing with sellers in control. but short term reversal could be near
Indicator 3) looks oversold however red line crossed above white line which i interpret as steady downward movement – no large runs down but potential for gap up reversal
Indicator 4) more distribution than accumulation. indicator lags behind other ones. not quite sure what to make of this one.
Looking for some of your thoughts to change the perspective.
regards,
Not Sure
https://www.reddit.com/gallery/1s4s0nr
Posted by e_defaut1
1 Comment
You’re overthinking it