
Crude Oil Analysis Update: Up to the mark projections
(MI Report: 26 March, 2026)
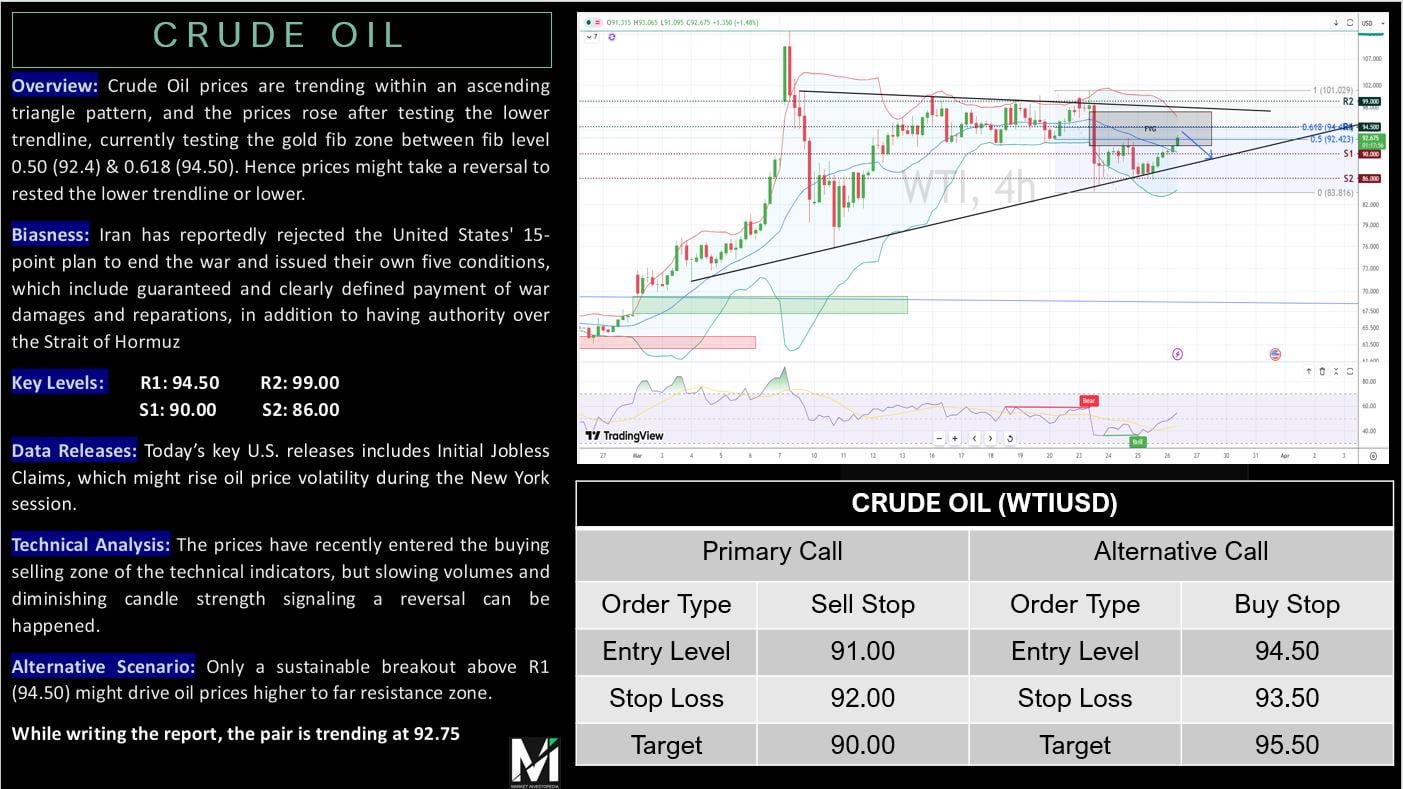
- When prices were rising after testing the lower trendline of the ascending triangle
-
We projected a decline in the prices and that prices might not be able to give a bullish breakout above R1 (or fib level 0.618) @ 94.50
-
Oil made highs of 94.20, failed to test R1, and then steeply fell in the ending market hours on Thursday
-
While re-testing the lower trendline of the ascending triangle, and making lows of 88.50 =
-
= around 570 pips from intraday highs (94.20) & 425 pips from last reporting price (92.75)
-
The Primary Sell Stop Signal hit targets, making 100 pips (SS attached below)
Updated chart attached below
https://i.redd.it/ziemkef7ijrg1.jpeg
Posted by No_Part6788