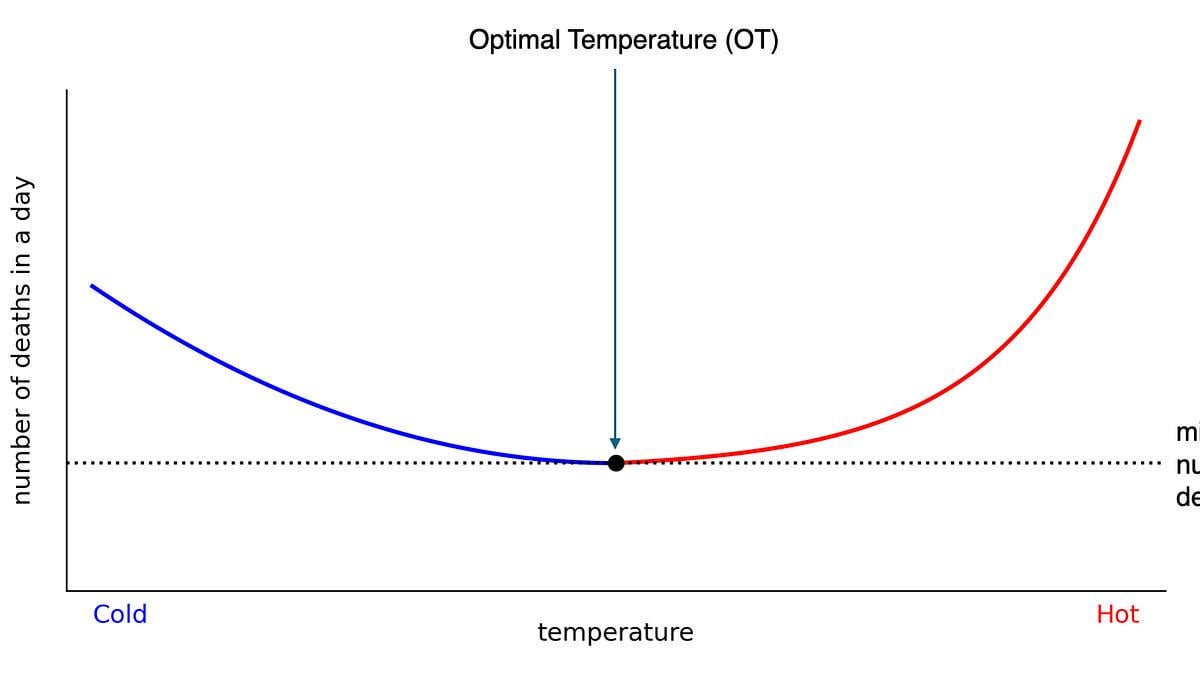
This graphic is a good start and will no doubt be refined in the future. One tweak I’d like to see is the addition of shading and/or a Z axis. The problem is one of attribution. For cold, hypothermia is a direct killer, but how do you tease out the signal from cold stress triggering a cardiac arrest? Same goes with heat. Heatstroke is a direct killer, but what if just being hot triggers a stroke?
Most of the research I’ve seen has – so far – been focused on the direct-cause type of deaths. Anyone reading and looking for a thesis project? We urgently need to invent methodologies for teasing out the signal when cold-and-heat are *triggering* and secondary causes of death, rather than the primary. That would make a could thesis or dissertation project for someone.

1 Comment
This graphic is a good start and will no doubt be refined in the future. One tweak I’d like to see is the addition of shading and/or a Z axis. The problem is one of attribution. For cold, hypothermia is a direct killer, but how do you tease out the signal from cold stress triggering a cardiac arrest? Same goes with heat. Heatstroke is a direct killer, but what if just being hot triggers a stroke?
Most of the research I’ve seen has – so far – been focused on the direct-cause type of deaths. Anyone reading and looking for a thesis project? We urgently need to invent methodologies for teasing out the signal when cold-and-heat are *triggering* and secondary causes of death, rather than the primary. That would make a could thesis or dissertation project for someone.