
China’s export growth slowed to 2.5% in March from a year earlier, missing expectations.
Imports surged 27.8% in March from a year ago, sharply beating expectations for a 11.2% growth.
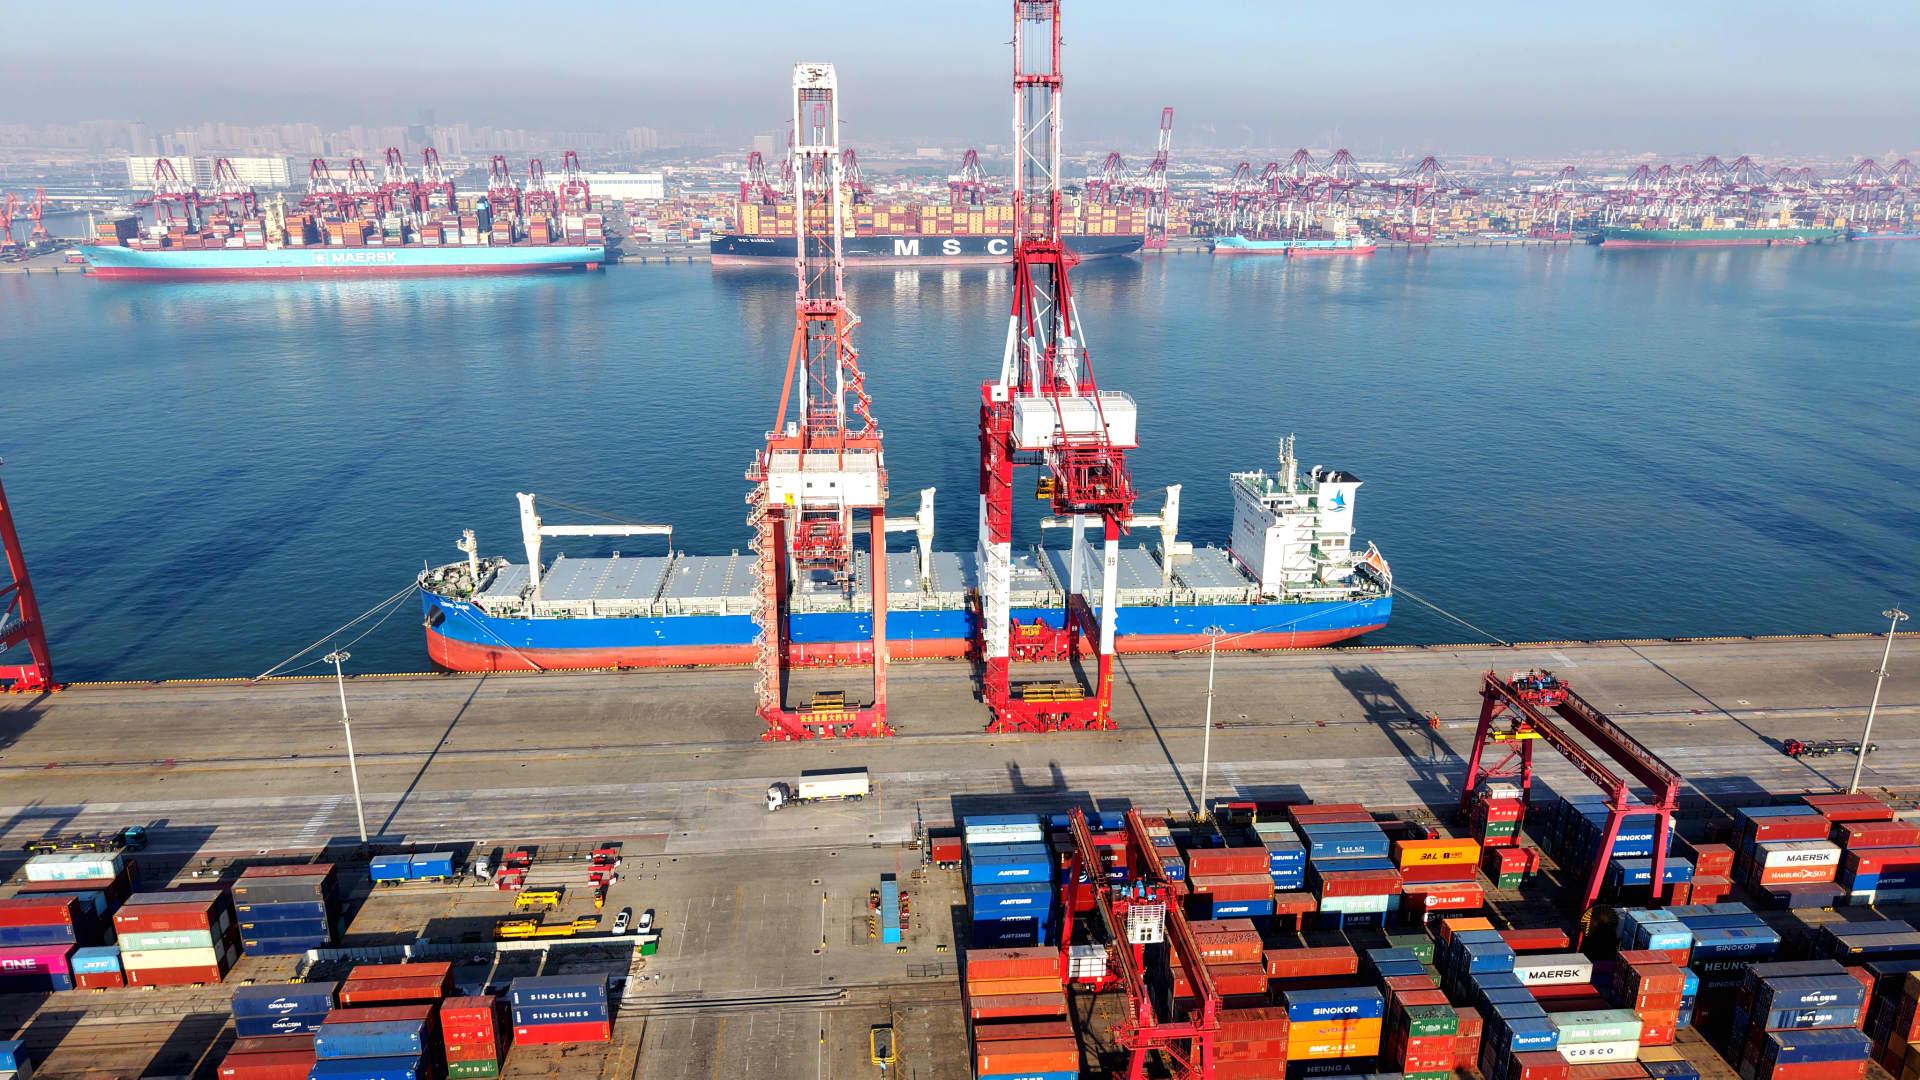
China’s export growth slowed in March as manufacturers grappled with surging commodity and energy costs due to the Middle East conflict disrupting supplies, while imports logged the strongest growth in more than four years.Exports grew at their slowest pace in six months at 2.5% in U.S. dollar terms last month from a year earlier, Chinese customs data showed Wednesday, missing Reuters-polled analysts’ median estimate for a 8.6% growth, and weakening from the combined 21.8% surge in the first two months of the year.
Imports surged 27.8% in March from a year ago, marking the strongest growth since November 2021, sharply beating expectations for a 11.2% growth, and quickening from 19.8% in the prior two months.
China releases combined trade data for January and February due to fluctuations around the Lunar New Year, the country’s biggest holiday, which follows the agrarian calendar.
The world’s second-largest economy has remained reliant on trade for its growth despite rising tensions with the U.S. and higher tariffs. Net exports accounted for about a third of China’s economy last year.
While Beijing’s strategic oil stockpiles, a diversified energy mix, and tight price controls have cushioned the blow from surging oil prices, the export-reliant economy remains vulnerable to a global economic downturn resulting from a prolonged closure of the Strait of Hormuz. In a press briefing on Tuesday, Wang Jun, China’s customs vice minister, said that global oil prices have experienced “fierce fluctuation,” creating a “complex and severe” trade environment.Higher commodity and energy prices stemming from the conflict have started feeding into Chinese manufacturers’ input costs, threatening to weigh on firms’ already thin margins. Factory-gate prices in the country rose by 0.5% in March, climbing for the first time in more than three years.
Source: https://www.cnbc.com/2026/04/14/china-trade-data-march-exports-imports-march.html
One of the economic data I routinely rely on to assess the health of a substantial portion of my portfolio, for rebalancing or hedging, that is being actively managed is trade data from China.
The data from China is paramount: China is a major trading partner for most countries, particularly with major Asian economics, the United States and with the European Union.
As a country whose economic model is dominated by highly – efficient manufacturing and export – driven activities, China provides me the first signal to consumption trend of the global economy – this allows positioning of my portfolio ahead of most retail.
Tying the bold print together: China is experiencing deflationary PPI (Chinese producers are outcompeting each other to produce goods that are ever cheaper) which would have been the envy of most western countries, if not for the fact that China as a whole is facing deflationary pressure across manufacturing and real estate.
It is important for me to preface the deflationary pressure in the real estate sector has slowed down over the past 4 years and, as a fraction of GDP, decline over the same time as China expands the size of its high – tech manufacturing base (biopharma, aerospace, defence, robotics, etc) and service – driven sector (software, A.I, consumer technology, etc).
As cost – efficient as their industrial base is and as secure their energy supply is (for now), it appears that the higher energy cost has already feed into their supply chain and impacted their economic competitiveness – what does this say for less competitive countries that are already struggling in the face of China's industrial might?
Going back to oil: European and Asian airlines have begun scaling back on flights due to supply and price shock of jet fuel. Brent and WTI crude spot price has fluctuate between just below $100 and $118 with US 10 Year bond between 4.1xxx% to 4.3xxx%, particularly with physical settle of crude going as high as $165 thereabout after factoring in on the ground bidding, insurance risk premium, pricing power, etc.
China's export data and commodities prices are both proxies I rely on to assess the economic health of the United States. As the Iran – US conflict runs into its 8th week, the US stock market continues to place all its chip on a tail event (a peace agreement) that has traditionally taken years to resolve.
The disconnect is this: the market may remain confident about a peace agreement (as unlikely as this may be) but hard economic information from the ground, and now from China, indicates that oil supply shock has entered the supply chain. On the US side, the US Fed may ignore March core CPI/ core PCE spikes but it is unlikely the US Fed would ignore spikes in April data onwards.
Some may argue that the US economy and stock market is entirely driven by US hyperscalers – CapEx is a concern before the US – Iran war with an anticipated much higher CapEx due to energy cost and commodity cost post conflict.
Happy to hear some formulated thoughts on the disconnect.
China exports miss estimates in March, imports post best growth in more than four years
byu/Plane-Try-6522 inStockMarket
Posted by Plane-Try-6522
1 Comment
L
China exports weak but demand strong af