
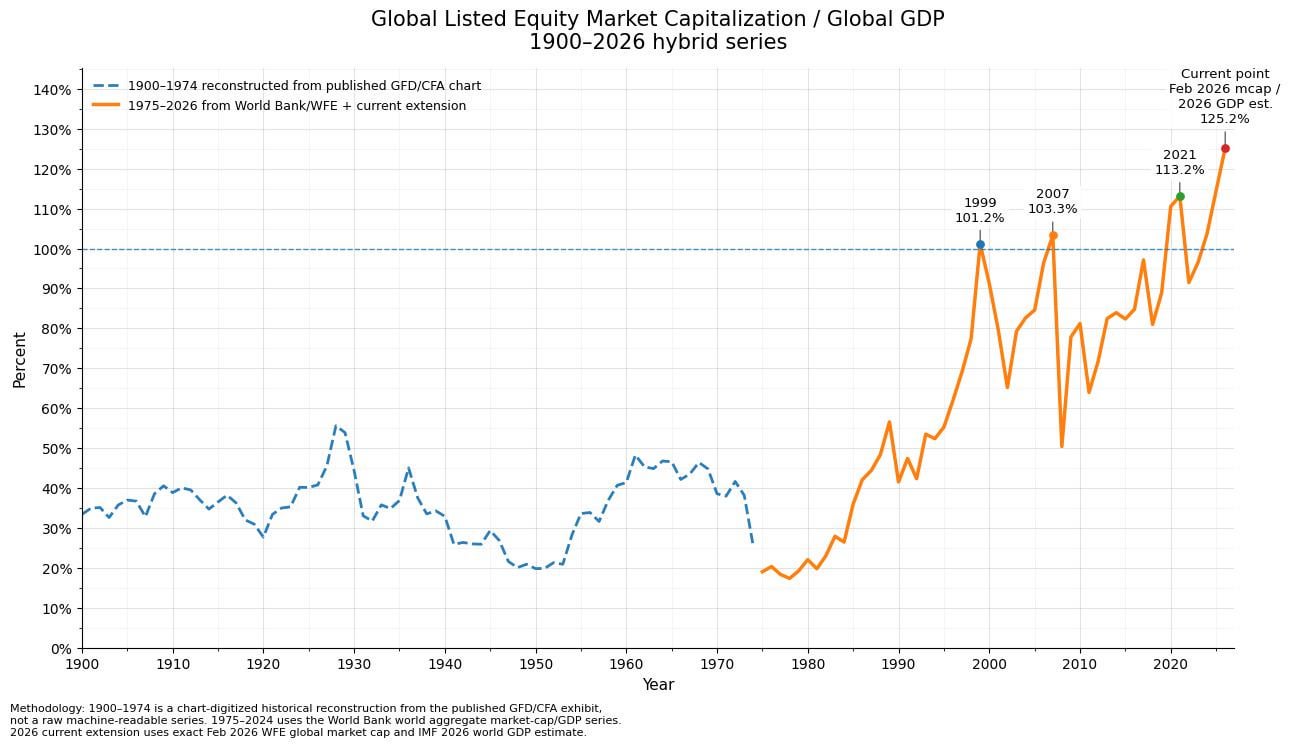
There seems to be some discussion on the famous Buffett indicator comparing US stock market capitalization to US GDP and it is true that it is less meaningful today since most large enterprises have significant global revenue.
A more modern and comprehensive such indicator comparing the total world stock market capitalization to global GDP is flashing the same warning signs though, especially with everything going on recently.
Can trees grow to the sky?
https://i.redd.it/yf54eko9havg1.jpeg
Posted by kanofree
6 Comments
Dam that’s a crazy graph
I don’t know anything about anything. But couldn’t it be partly because of the rise of the internet and the general popularity of the stock market for retail folks?
Historical valuation metrics are no longer relevant
Market dynamics have changed
There is no longer an “reasonable” upper limit (i.e., “overvalued”) for equity valuations relative to gdp, earnings/fundamentals, etc.
Tldr: bullish, calls
The more money they print the higher it goes.
Wheeee.
More companies are listed compared to private companies?
And here is the [snp500 p/e](https://www.multpl.com/s-p-500-pe-ratio). Not cheap, but not stretched either.