
TL;DR: I tested the four dealer-exposure Greeks (GEX, DEX, VEX, CHEX) against next-day SPY outcomes on 1,972 end-of-day snapshots from Apr 2018 to Apr 2026. Raw GEX looks strong (Spearman ρ = -0.36, p ≈ 10⁻⁶⁰). After controlling for VIX and ATM IV, it drops to ρ = -0.03 (not significant). DEX has no signal even raw. VEX is basically a VIX proxy. CHEX is borderline noise at EOD. Hypotheses were pre-registered before the stats.
What I did
For each of 1,972 SPY trading days I joined same-session GEX, DEX, VEX, CHEX, gamma flip, VIX, ATM IV – with next-day return, next-day realized vol, next-day IV change.
- Sort days into 5 equal groups ("quintiles") by the exposure I'm testing, check the next-day outcome.
- Then residualize: regress the signal and the outcome on VIX (or VIX + ATM IV), take the residuals, re-run. If the signal has independent information, it still works. If it was a VIX proxy, it dies.
- I wrote the hypotheses down in a file before running any stats. Saves me from convincing myself of whatever the data happened to show.
Quick glossary for non-quants:
- Quintile = 5 equal groups. Q1 = lowest 20%, Q5 = highest 20%.
- Spearman ρ = rank correlation, from -1 to +1. +1 = ranks line up perfectly. -1 = perfectly opposite. 0 = random.
The raw GEX result – this is what sells subscriptions
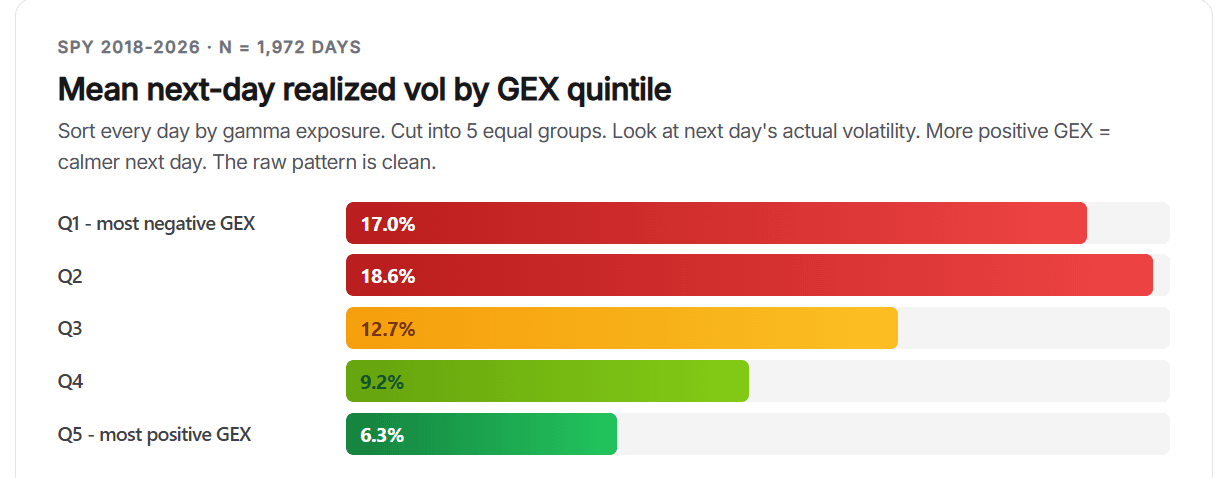
Next-day realized vol (%, annualized) by GEX quintile:
| GEX quintile | n | Mean next-day RV |
|---|---|---|
| Q1 (most negative) | 395 | 17.0% |
| Q2 | 394 | 18.6% |
| Q3 (neutral) | 394 | 12.7% |
| Q4 | 394 | 9.2% |
| Q5 (most positive) | 394 | 6.3% |
Spearman ρ = -0.36, p ≈ 10⁻⁶⁰. On an 8-year sample that's statistically real. The Q1/Q2 mean inversion is COVID-era outliers; medians are cleanly monotonic.
The twist – what happens when you control for VIX and ATM IV
| Signal → Outcome | Raw ρ | After VIX ctrl | After VIX + ATM IV |
|---|---|---|---|
| GEX → next-day RV | -0.36 | -0.14 | -0.03 (p=0.18) |
| DEX → next-day return | -0.03 | +0.01 | +0.02 |
| VEX → next-day IV change | -0.16 | -0.05 | -0.01 |
| CHEX → next-day return | -0.05 | -0.01 | -0.00 |
GEX survives a VIX-only control (weakened). Dies when ATM IV joins. The other three never had much to lose.
The real killer – double-sort heatmap
5×5 grid: rows = VIX quintile (V1 calmest, V5 most stressed), columns = GEX quintile. Cell = mean next-day realized vol (%).
| VIX GEX | Q1 | Q2 | Q3 | Q4 | Q5 |
|---|---|---|---|---|---|
| V1 (low) | 8.0 | 7.3 | 6.6 | 5.2 | 5.1 |
| V2 | 11.7 | 10.3 | 8.8 | 6.5 | 6.0 |
| V3 | 12.0 | 12.1 | 12.2 | 9.6 | 8.6 |
| V4 | 15.9 | 15.4 | 17.2 | 12.3 | 8.1 |
| V5 (high) | 20.6 | 24.9 | 37.7 | 21.7 | 15.9 |
Rows V1–V2 look textbook. V3–V4 are close but not strictly monotonic. V5 – the stressed regime where you actually want a signal – is a non-monotonic mess. Middle GEX has the highest RV in the entire grid.
The GEX regime split confirms it: on the top-VIX-quartile subset of 493 days, the top-vs-bottom GEX next-day RV difference is -1.89 vol points, t = -0.78, p = 0.44. No signal at all in the regime people care about most.
One-line verdicts
- GEX – useful regime descriptor (positive = dealers absorb flow = pinning; negative = dealers amplify = wider tape), but no independent alpha over VIX + IV.
- DEX – zero predictive content. Top-vs-bottom next-day return diff = 0.00%, p = 0.97.
- VEX – 72% correlated with VIX, 76% with ATM IV. Strip those out, nothing remains.
- CHEX – 54.9% sign-agreement with next-day return raw (p = 10⁻⁵). Dies under any rank control. EOD only-this study does not test the intraday last-hour-charm narrative; minute-level data is needed for that.
Collinearity matters too: DEX and VEX correlate with each other at -0.89. They are two sides of one coin.
What I'd actually do with this
- Ignore GEX in high-VIX regimes. In the top VIX quartile, the signal is noise.
- In calm regimes, GEX as a vol-label is fine – just know VIX would have labeled the regime the same way, and VIX is free to quote.
- Stop counting GEX/DEX/VEX/CHEX as four independent signals. They span roughly 1.5 effective dimensions, and VIX+IV already covers most of those.
- If you want real independent edge, the signal has to be orthogonal to VIX and IV. None of the four dealer-exposure Greeks are. Candidates worth running the same test on: VIX term structure (VIX/VIX3M), realized-minus-implied skew, order-flow imbalance, VRP residuals.
Honest caveats (these matter more than the headline)
- EOD only. No intraday CHEX test.
- SPY only. Single names will likely look worse (less dealer hedging, more idiosyncratic drift).
- Linear OLS residualization – a nonlinear model could extract edge OLS misses.
- Correlation, not PnL. A residual ρ of -0.14 does not automatically become a profitable strategy after costs, slippage, and execution lag.
- 2022 is the only real bear year. High-VIX regime inference rests on ~493 days.
- Dealer-sign convention: positive = dealers net long that Greek. Vendors using the opposite sign will see everything flipped – conclusions identical.
Data and full write-up
Full article with regime splits, train/test (70/30), correlation matrix, per-exposure verdicts, limitations, and downloadable CSV artifacts: https://flashalpha.com/articles/gex-dex-vex-chex-8-year-backtest-spy-vix-control
https://i.redd.it/b75yb3baywwg1.png
Posted by FlashAlphaLab