
Hey guys, been heads-down for the last couple weeks building a proper SPY put credit spread backtest and I think I have a few findings worth sharing. Posting the highlights here, full writeup with all the tables and numbers is linked at the bottom.
TL;DR – what made the exercise very difficult was adding realistic fill simulation. Every strategy that was making +5,000% suddenly started stopping out on drawdown or going outright bankrupt. Once the simulator stopped letting me fill at the mid, half the "winning" cells flipped negative. Once I added a stop loss, the cells that had been wiping out flipped to category-leading. Almost everything I assumed was either wrong or required one specific guardrail to not blow up.
Setup
- 7 years of SPY 1-min option chains (2019-02 → 2026-04)
- 96 grid cells across (delta, DTE, profit-take, stop-loss)
- MM-style limit fills – post at
combo_ask + $0.04, wait for someone to cross. ~20-25% fill rate, ~12 min average wait, mean fill 4-7 cents worse than mid - VRP signal that strictly cannot see the future (CSV shifted +1 day, walked back at runtime)
- Half-Kelly sizing × signal multiplier, capped at 1.0
- 30% drawdown circuit breaker that just halts the whole run when things go bad
- 16,024 trades validated end-to-end
The eight findings
1. Mid-fill backtests overstate CAGR by 30-60%. Switching from "fill at mid" to "post a limit and wait" dropped numbers across the entire grid. Several cells flipped from positive to negative. The strategy didn't change – only the simulator's assumption about who fills whom. If your backtest fills at mid you're silently gifting yourself 4-7 cents per contract every trade.
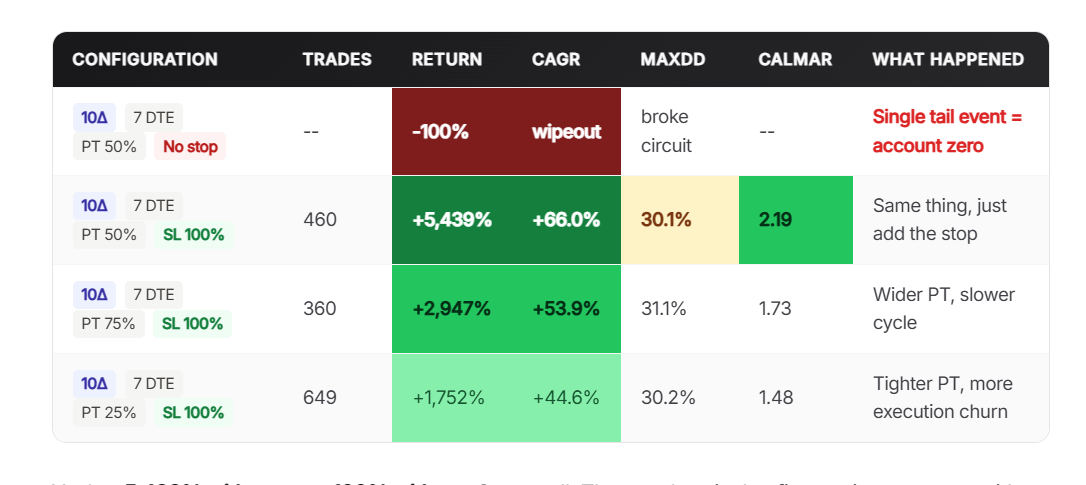
2. The stop loss IS the strategy at short DTE. Same cell, same fills, same period. With a stop at 100% of credit collected: +5,439%. Without one: -100% wipeout on a single tail event. That's not a fine-tuning parameter, that's the entire game.
3. There's a sweet spot in the middle of the grid. Mid-DTE, mid-PT, low delta. Calmar above 2, Sharpe above 1.5, low double-digit drawdown. I'm not posting the exact coordinates – it's the only thing in this whole project worth keeping private and the recipe is useless without the same historical chains anyway. What I will say is what the sweet spot is not: not the highest CAGR cell (those have 30%+ drawdowns), not the highest Sharpe cell (39.7% drawdown), not the shortest or longest DTE, not the highest delta.
4. SL=200% is worse than no stop loss. Yes really. Same 45Δ DTE30 cell at three stop settings:
- No stop → +30.6%
- SL 100% → +28.0%
- SL 200% → -16.5%
By the time the loss has grown to 200% of credit, you're deep ITM and gamma is doing the marking. You stop out at a terrible price after letting the position breathe past recovery. Either pick tight or pick none. The middle is the trap.
5. I built a fancy 3-layer signal. A one-line boolean flag beat it. Premium / Danger / Stabilization composites, z-scored macro inputs, continuous Kelly multiplier, the whole nine yards. Then ran t-tests across all 16k trades. The single strongest predictor was a one-liner with t > 8 – the kind of thing you can compute in three lines of pandas. My fancy composite added something on top, but the signal-to-noise was mostly in the simple flag.
The lesson: if your "edge" is a 47-feature gradient-boosted model, check what one obvious flag does. Most signal engineering is just expensive ways to discover one boring flag.
6. Multi-DTE flexibility cost me 9pp of CAGR. Seemed obvious – rank candidates across 30/45/60-DTE chains every entry, pick the best EV/risk, let the term structure tell you which tenor is most attractive. Built it. Ran it. Pooling underperformed focused single-DTE by ~9pp of CAGR. The ranker rationally preferred 30-DTE most of the time. When it picked 45-DTE it was specifically because the 30-DTE chain looked worse than usual that bar – meaning the 45-DTE bucket got adversely selected. More degrees of freedom = the optimizer can also fail in more ways.
7. Higher delta moves equity vol, not alpha. I expected higher delta to mean more edge – more credit per contract, more theta. Instead, raising delta from 10 to 30 to 45 raised CAGR and raised MaxDD in roughly equal proportion. Calmar stayed approximately flat. Delta is just how big you want the swings.
8. The bug log was humbling. Every one of these would have inflated my headline numbers, and most were caught only after a code review:
- Mid-fill (flipped multiple losing strategies positive)
- Look-ahead in signal lookup (~5-10pp CAGR inflation)
- Stale-quote acceptance (~30% of fills had negative edge captured)
- EV-sorted tiebreak when two limits crossed same bar (small but real oracle)
- Warmup-period sizing bug (cratered 2018 results)
I have an archive_v3_grid/ folder with the same engine on the same data with all the bias bugs intact. Every cell in there returned -1% to -8% CAGR. So when the post-fix numbers turned positive, that wasn't simulator noise – that was what the bias was masking.
If you're building your own backtest and the numbers look great on the first run, you have a bug. Find it.
What I'd actually do differently if you're starting
- Build the limit-fill model first. Don't bother running anything until your fills aren't free.
- Run the SL=100% vs no-stop comparison on a tiny grid before anything else. If your engine can't reproduce the wipeout, your tail isn't being modeled correctly.
- Don't add multi-DTE flexibility until you've maxed out single-DTE. More flexibility = more ways to be wrong.
- Run your fancy signal against the most obvious one-liner you can think of first. If the one-liner does 80% of the work, you're overfitting the residual.
Caveats
Standard ones. All numbers are in-sample over 2019-2026. The cell choice and the signal thresholds were both made looking at the same window the engine ran against. Walk-forward train/test split (2019-2022 train, 2023-2026 evaluate untouched) is the next gate before anything goes live. This is a backtest, not a track record.
Full writeup with all the tables, exact numbers Link
Happy to answer questions on methodology in the comments.
https://i.redd.it/5uwy7il4ixxg1.png
Posted by FlashAlphaLab
1 Comment
Ai is destroying Reddit