
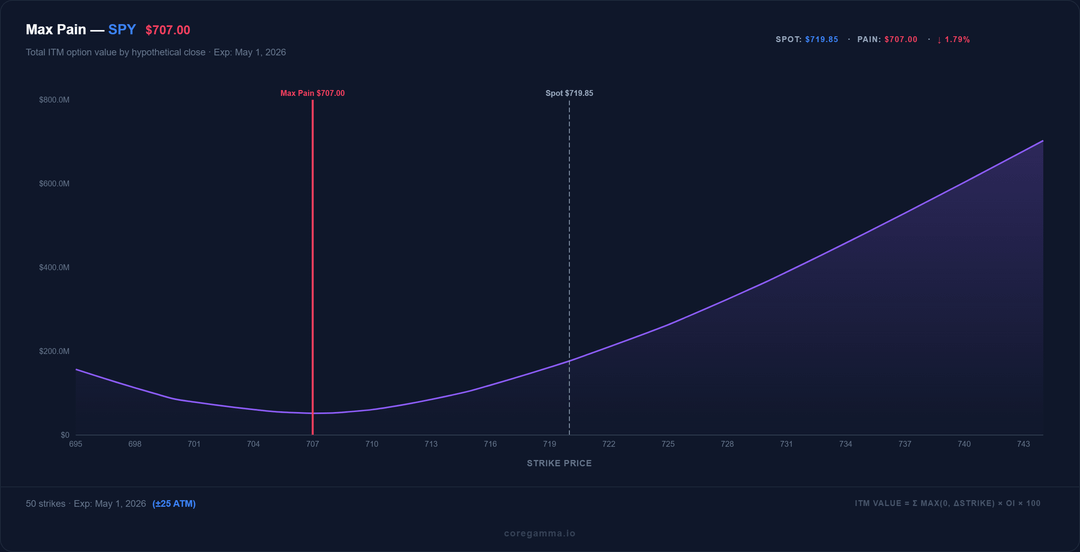
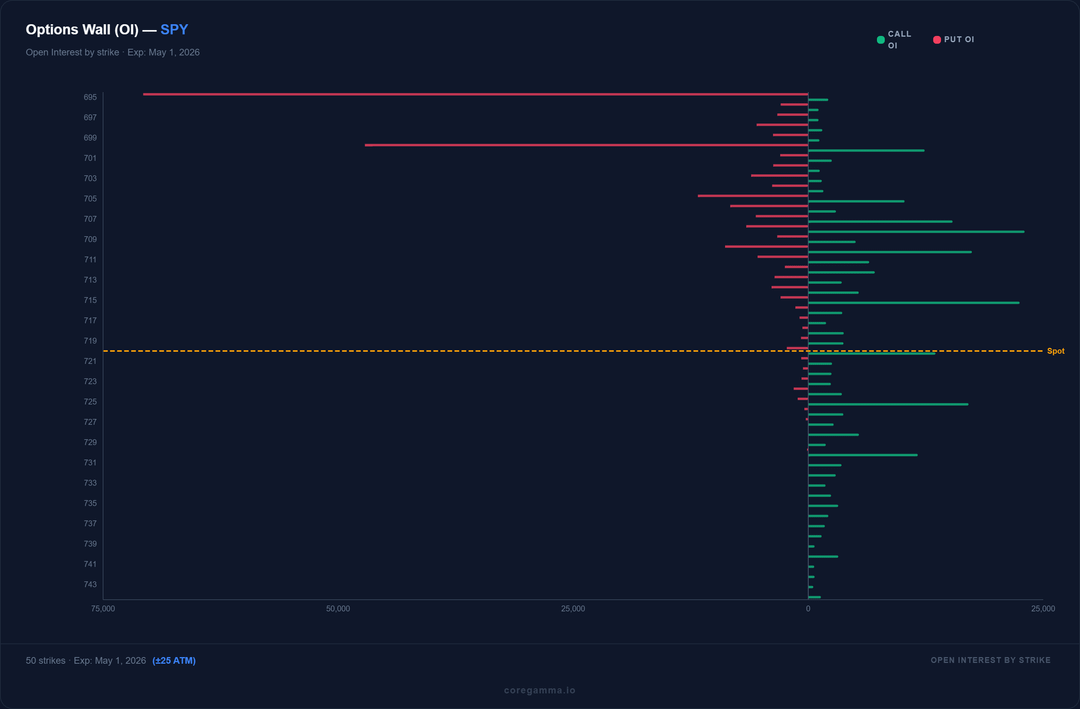
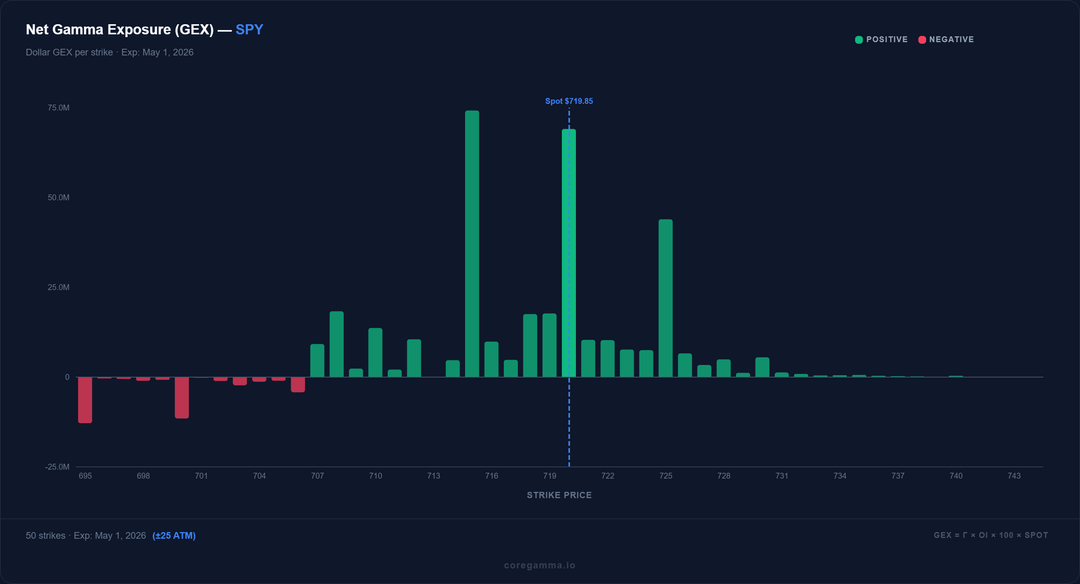
I have recently added options data to my platform at the request of a friend. I have noticed online that the metrics day traders like to monitor with options is GEX or Gamma Exposure, Open Interest to determine 'walls', and max pain strikes where market makers pay out the least.
I am not new to options but I am new to monitoring this sort of data as this is not how I use/trade options personally. I am looking for feedback on my attached screenshots. When I understood the calculation needed to actually build a chart, these seemed like the most intuitive approach for me. I also have a tendency to overlook obvious factors that are needed in building such datasets.
If you could visualize the same data in a different way, how would you do it? Where does one find the actionable intellegence in this layer of data?
Thank you for any help or advice.
https://www.reddit.com/gallery/1t0hbfb
Posted by coregamma
1 Comment
Gammastrike