
I’ve always been skeptical of "trading psychology" advice until I actually saw my own numbers. I recently pulled a massive CSV export of my last few years of trading (3,000+ trades ) and ran them through a local analyzer to see where the leak was.
The most jarring stat wasn't the win rate—it was the Consecutive Loss Behavior.
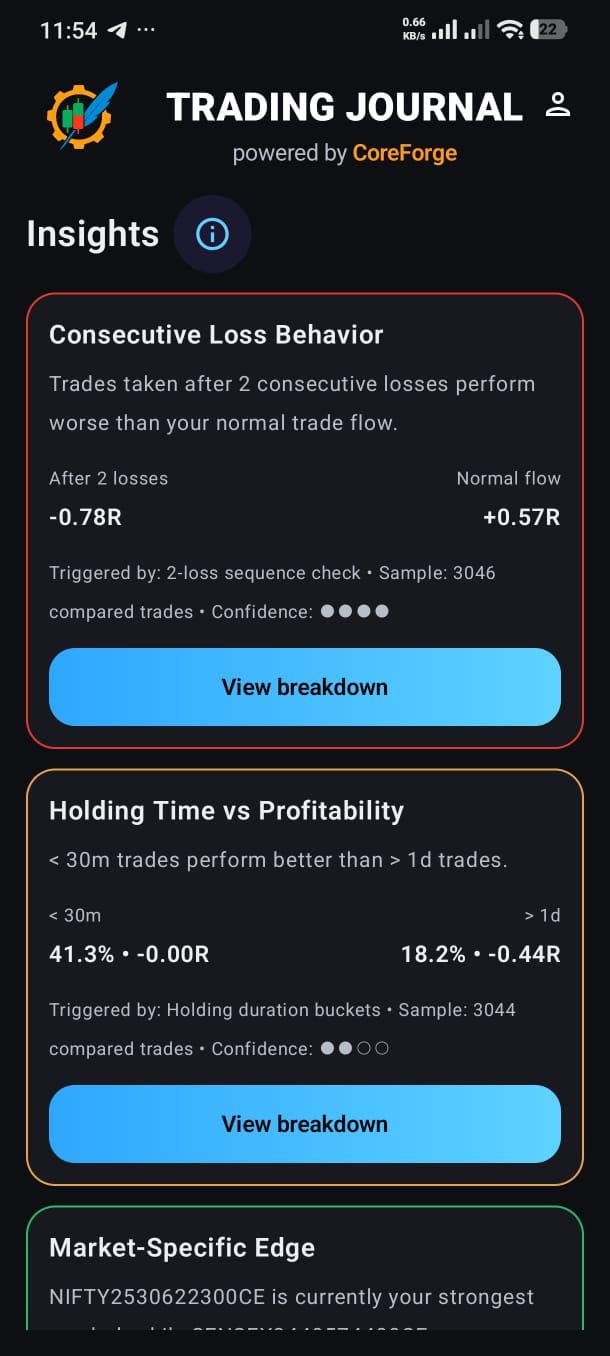
The "Tilt" is Mathematically Provable
According to the data, my "Normal Flow" expectancy is +0.57R. However, the moment I hit a streak of 2 consecutive losses, my expectancy for the very next trade drops to -0.78R.
I used to tell myself I was "trading through the slump," but the data shows I was essentially just paying a "tilt tax" to the market. My performance doesn't just dip; it completely reverses.
A few other observations from the 3k sample:
Holding Time vs. Profitability: There is a sharp drop-off in performance based on duration. Trades held for < 30 mins have a significantly higher success rate than those that turn into "accidental swings" held for > 1 day. My win rate on those long-holds is a dismal 18.2%.
The R:R Paradox: My overall win rate is only 29%, yet the net P/L is positive. It’s a good reminder that you can be "wrong" 70% of the time and still be profitable if your average winner is 3.91x your average loser.
Weekday Variance: My strongest expectancy is on Mondays (+0.34R), while Tuesdays (-0.28R) are consistently my worst performing days.
Why I’m sharing this
If you have years of trade data sitting in broker exports, it’s worth the effort to crunch the numbers on your behavioral patterns rather than just your strategy. Seeing a red box that says your "Confidence" is low because of a loss-streak makes it much harder to justify that next revenge trade.
Does anyone else track their expectancy specifically after a loss? I’m curious if a -1.35R swing (from +0.57 to -0.78) is standard for retail traders or if I just have a particularly bad case of revenge trading.
https://i.redd.it/xanvwj4a79zg1.jpeg
Posted by Dr_Dispute