
Note: this is aggregate statistical analysis across 124 trades, not a journal entry or individual position post. No tickers or per-trade details, just pattern data from 9 months of logging.
Been meaning to do this for a while. I trade directional options (buy puts and buy calls, no spreads) and I've been logging everything entry, exit, DTE at entry, hold days, outcome. Finally sat down and list it all out.
Headline numbers (124 trades, Apr-Dec 2025):
- Overall win rate: 67.7%
- Net P&L: +$25,818
- Avg hold: 14 days
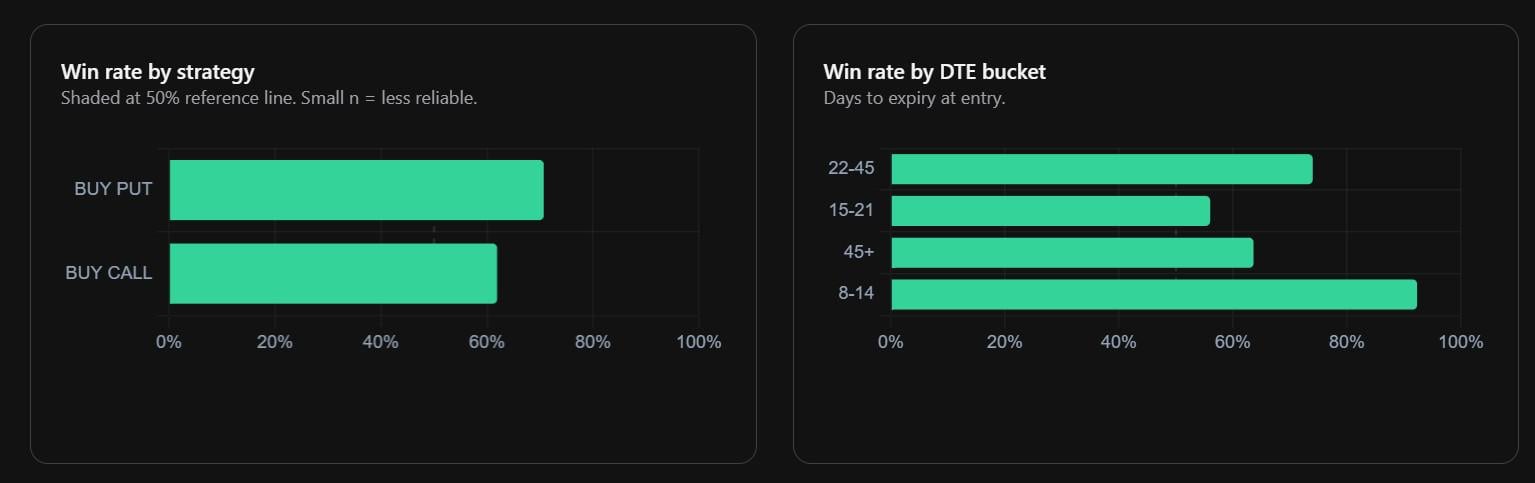
- BUY PUT win rate: 70.7%
- BUY CALL win rate: 61.9%
Win rate by DTE at entry:
- 8-14 DTE: 92.3%
- 22-45 DTE: 74.0%
- 45+ DTE: 63.6%
- 15-21 DTE: 56.0%
The 8-14 vs 15-21 gap is the weird one. I expected a smooth curve. Instead my 15-21 DTE bucket is my worst. My theory is I've been entering these when IV is elevated mid-week expecting a move that doesn't materialize by expiry, basically buying overpriced options at the worst time horizon. But that's speculation.
124 trades is a real number but not a huge sample. I'm not claiming this generalizes. This is my data and my strategies. Your results will differ.
Has anyone else done this kind of DTE breakdown on their own trades? Curious if the 8-14 sweet spot shows up for others or if it's just my setup.
https://i.redd.it/ijpdau226tzg1.jpeg
Posted by Altruistic-Pin3207