
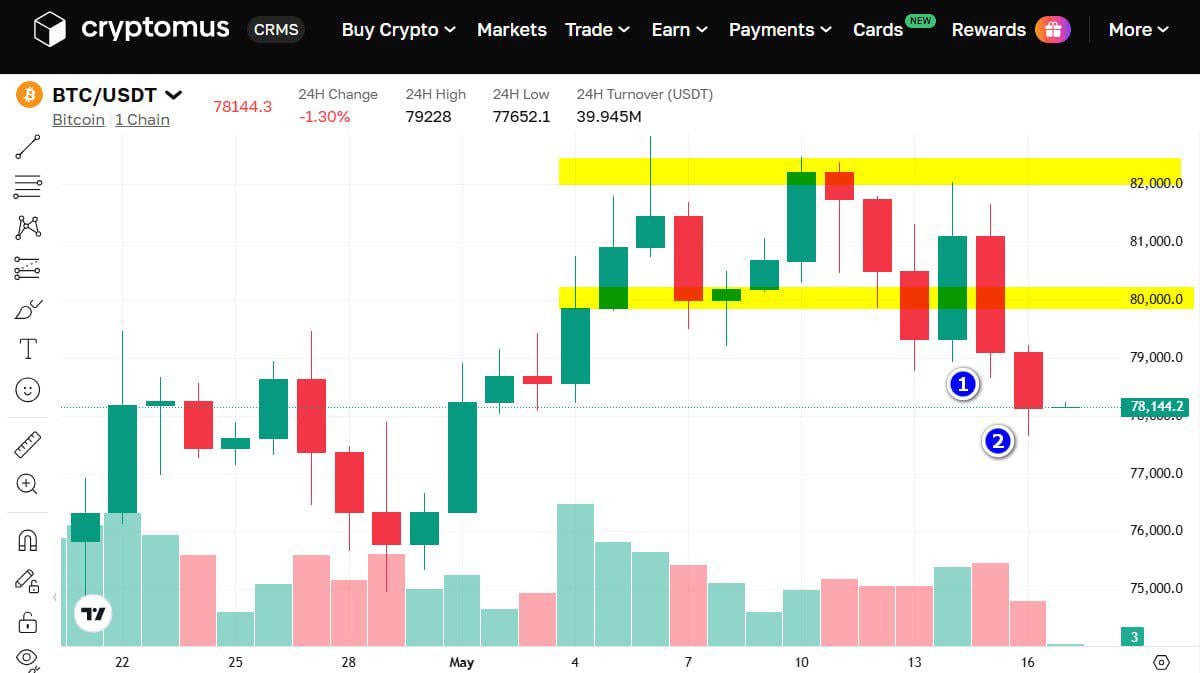
Analysts are highlighting the $82K level for Bitcoin, where prices formed either a double top or a 'head and shoulders' pattern. Both of these are reversal signals, which is precisely what occurred on the chart, followed by a fall below the previous support level of $80K.
However, on-chain data reveals a more intriguing battle between short-term (STH) holders and Bitcoin whales.
The $80K level marks the average entry price for STH holders, who began to take profits as prices increased. It was these sales that triggered Bitcoin’s three-day decline from 11 to 13 May. The bulls' attempt to push the price back above $80k led to Friday's panic sell-off. STH transactions accounted for 97% of all Bitcoin sales.
Evidently, a BTC price below $80K is highly attractive to whales. They secretly purchased $24 billion worth of the cryptocurrency. All trades were conducted through OTC desks to minimise the impact on Bitcoin’s price. Interest from bulls was so strong that the market experienced a rare moment where OTC volumes dominated CEX volumes by 69% to 31%.
Here’s the result. As the chart shows, the bulls gave up the $80K level, with the closing prices of two candles falling below the support line. However, the secret deals indicate significant Bitcoin accumulation.
https://i.redd.it/x8hedzqtum1h1.jpeg
Posted by tornavec