
https://www.brixnation.com/stock-market-indicators.html
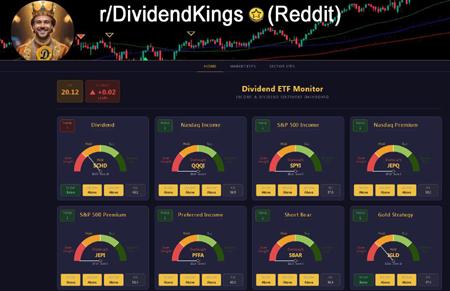
Track market sentiment across 36 ETFs with our free daily dashboard. Visual gas gauge indicators show overbought, hold, buy, and extreme buy signals at a glance.
Covers sector ETFs, high-yield dividend ETFs, and broad market ETFs updated daily after market close using 50, 100, and 200 day moving averages plus RSI.
Also includes a live VIX fear gauge so you always know the current market temperature.
https://i.redd.it/1s7wsjpg29vg1.jpeg
Posted by Daily-Trader-247
1 Comment
No thanks.