
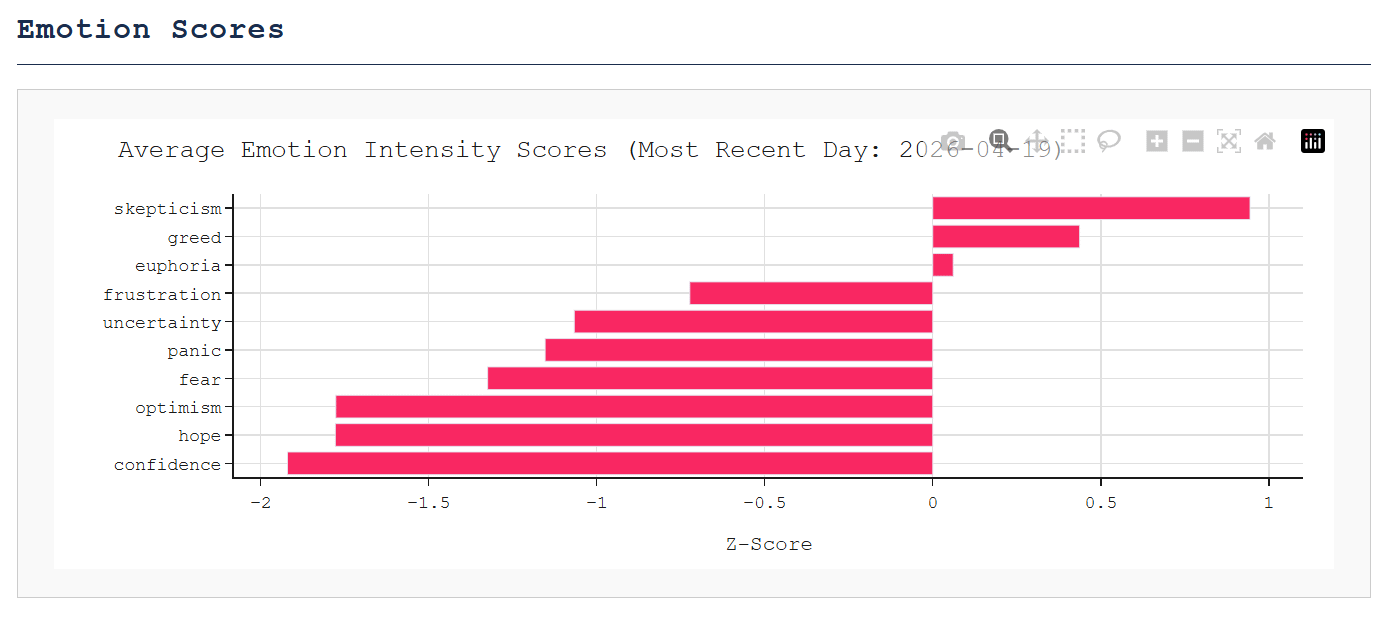
So I track narrative-level emotion data across markets (it's a whole thing, don't ask) and today's readout is pretty telling. Skepticism just printed as the top emotion at a z-score of +0.94. Confidence is in the gutter at -1.92. Optimism not far behind at -1.78.
You can probably guess why. Strait of Hormuz headlines again. Geopolitical risk attention jumped 229% day-over-day, energy insecurity right behind it at 225%, commodities supercycle up 329%. The usual cascade.
But here's what's actually interesting, people aren't panicking anymore. Fear is below average at -1.48. Panic is subdued. The vibe is more "yeah yeah, we've heard this one before" than genuine alarm. That's a materially different emotion signature than the March scare when fear was actually running hot.
Geopolitical risk is sitting at the 6th percentile of its 260-day range. But the narrative's SIR lifecycle (i model it as a virus, followin Shillers book on onarratives) score puts it firmly in the exhaustion phase with an R0 of 0.99, barely below the reproduction threshold. High attention + skepticism dominant + exhaustion phase usually means the spike burns out relatively fast.
Today's data is still intraday so things could shift, but if skepticism holds through the weekend I'd be inclined to fade the energy move. .
Just sharing what the narrative data is showing and whats on my mind. Make of it what you will.
https://i.redd.it/az08v12m63wg1.png
Posted by atc2017
1 Comment
Wow this is a great set of statistics. How do you source it? Did you code a program to go through all the daily headlines? How’d you get it to automatically categorize it within these 10 categories?