
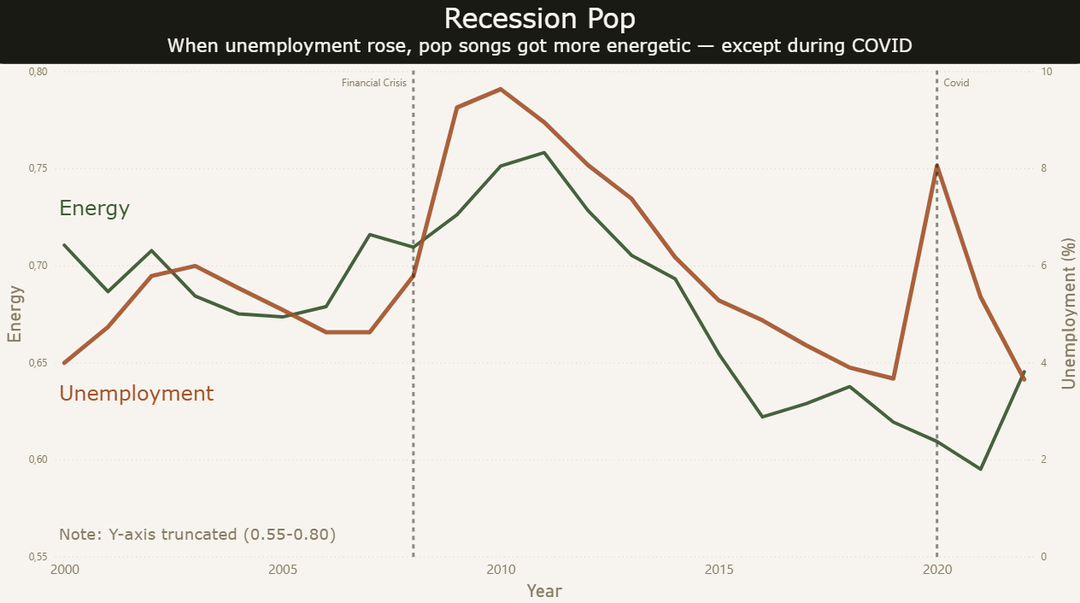
I correlated US unemployment data with Spotify audio features from Billboard's yearly top songs (2000–2022).
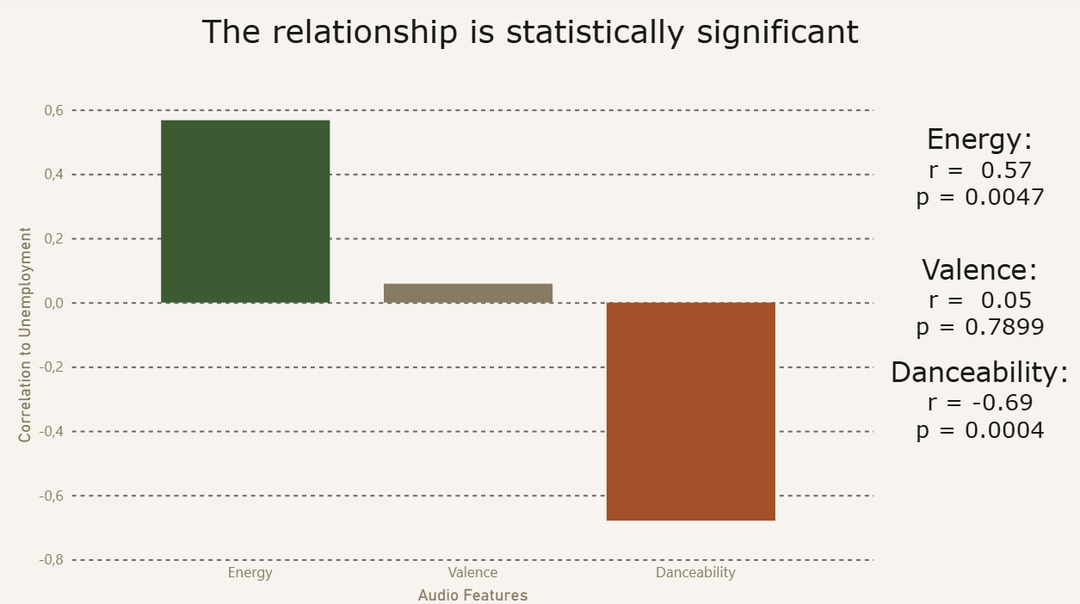
Key findings:
- Energy: r = 0.57, p = 0.005
- Danceability: r = −0.69, p = 0.0004
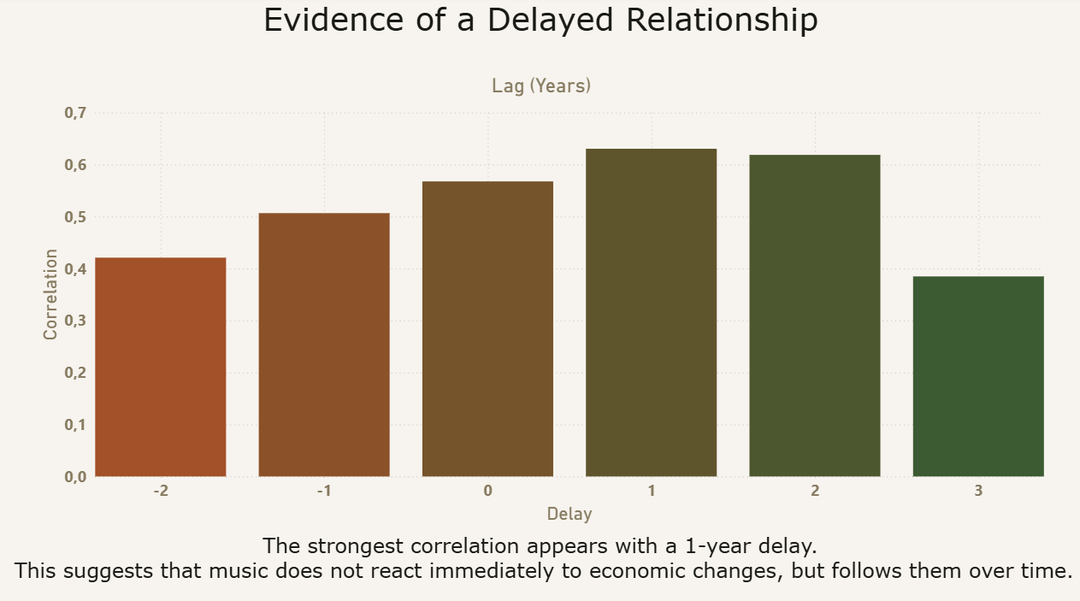
- Lag analysis suggests music follows economic shifts by ~1 year
The COVID period breaks the pattern — unemployment spiked but energy dropped, unlike 2008.
All charts made with Python/Power BI. Full methodology on GitHub:
https://www.reddit.com/gallery/1tep2a8
Posted by Prestigious_Tip_389
1 Comment
It’s an example of a spurious correlation.